
Swing trading is an approach that aims to capture short- to medium-term gains in a stock (or any financial instrument) over a period of a few days to several weeks. This trading style focuses on profiting from price swings in the market. Unlike day trading, which involves making multiple trades within a single day, swing trading allows traders to hold positions longer, giving them the potential to capitalize on more significant price movements.
Swing traders rely heavily on technical analysis to identify entry and exit points, using tools such as moving averages, Relative Strength Index (RSI), and MACD to make informed decisions. The goal is to enter trades at the beginning of a price move and exit before the trend reverses.
The strategies employed in swing trading can vary widely but generally involve trend-following, momentum trading, and mean reversion techniques. **Trend-following
strategies focus on identifying and trading in the direction of the prevailing trend, while momentum trading seeks to capitalize on the market’s momentum by entering trades when prices are moving strongly in one direction. Mean reversion strategies, on the other hand, involve trading against the prevailing trend, based on the belief that prices will revert to their mean or average levels.
Effective risk management is crucial in swing trading, as it helps protect capital and ensure long-term profitability. This includes setting stop-loss orders to limit potential losses and using proper position sizing techniques to manage risk. The benefits of swing trading include the ability to take advantage of significant price movements, reduced stress compared to day trading, and the flexibility to combine it with other trading styles or a full-time job.
Table of Contents
What is Swing Trading?
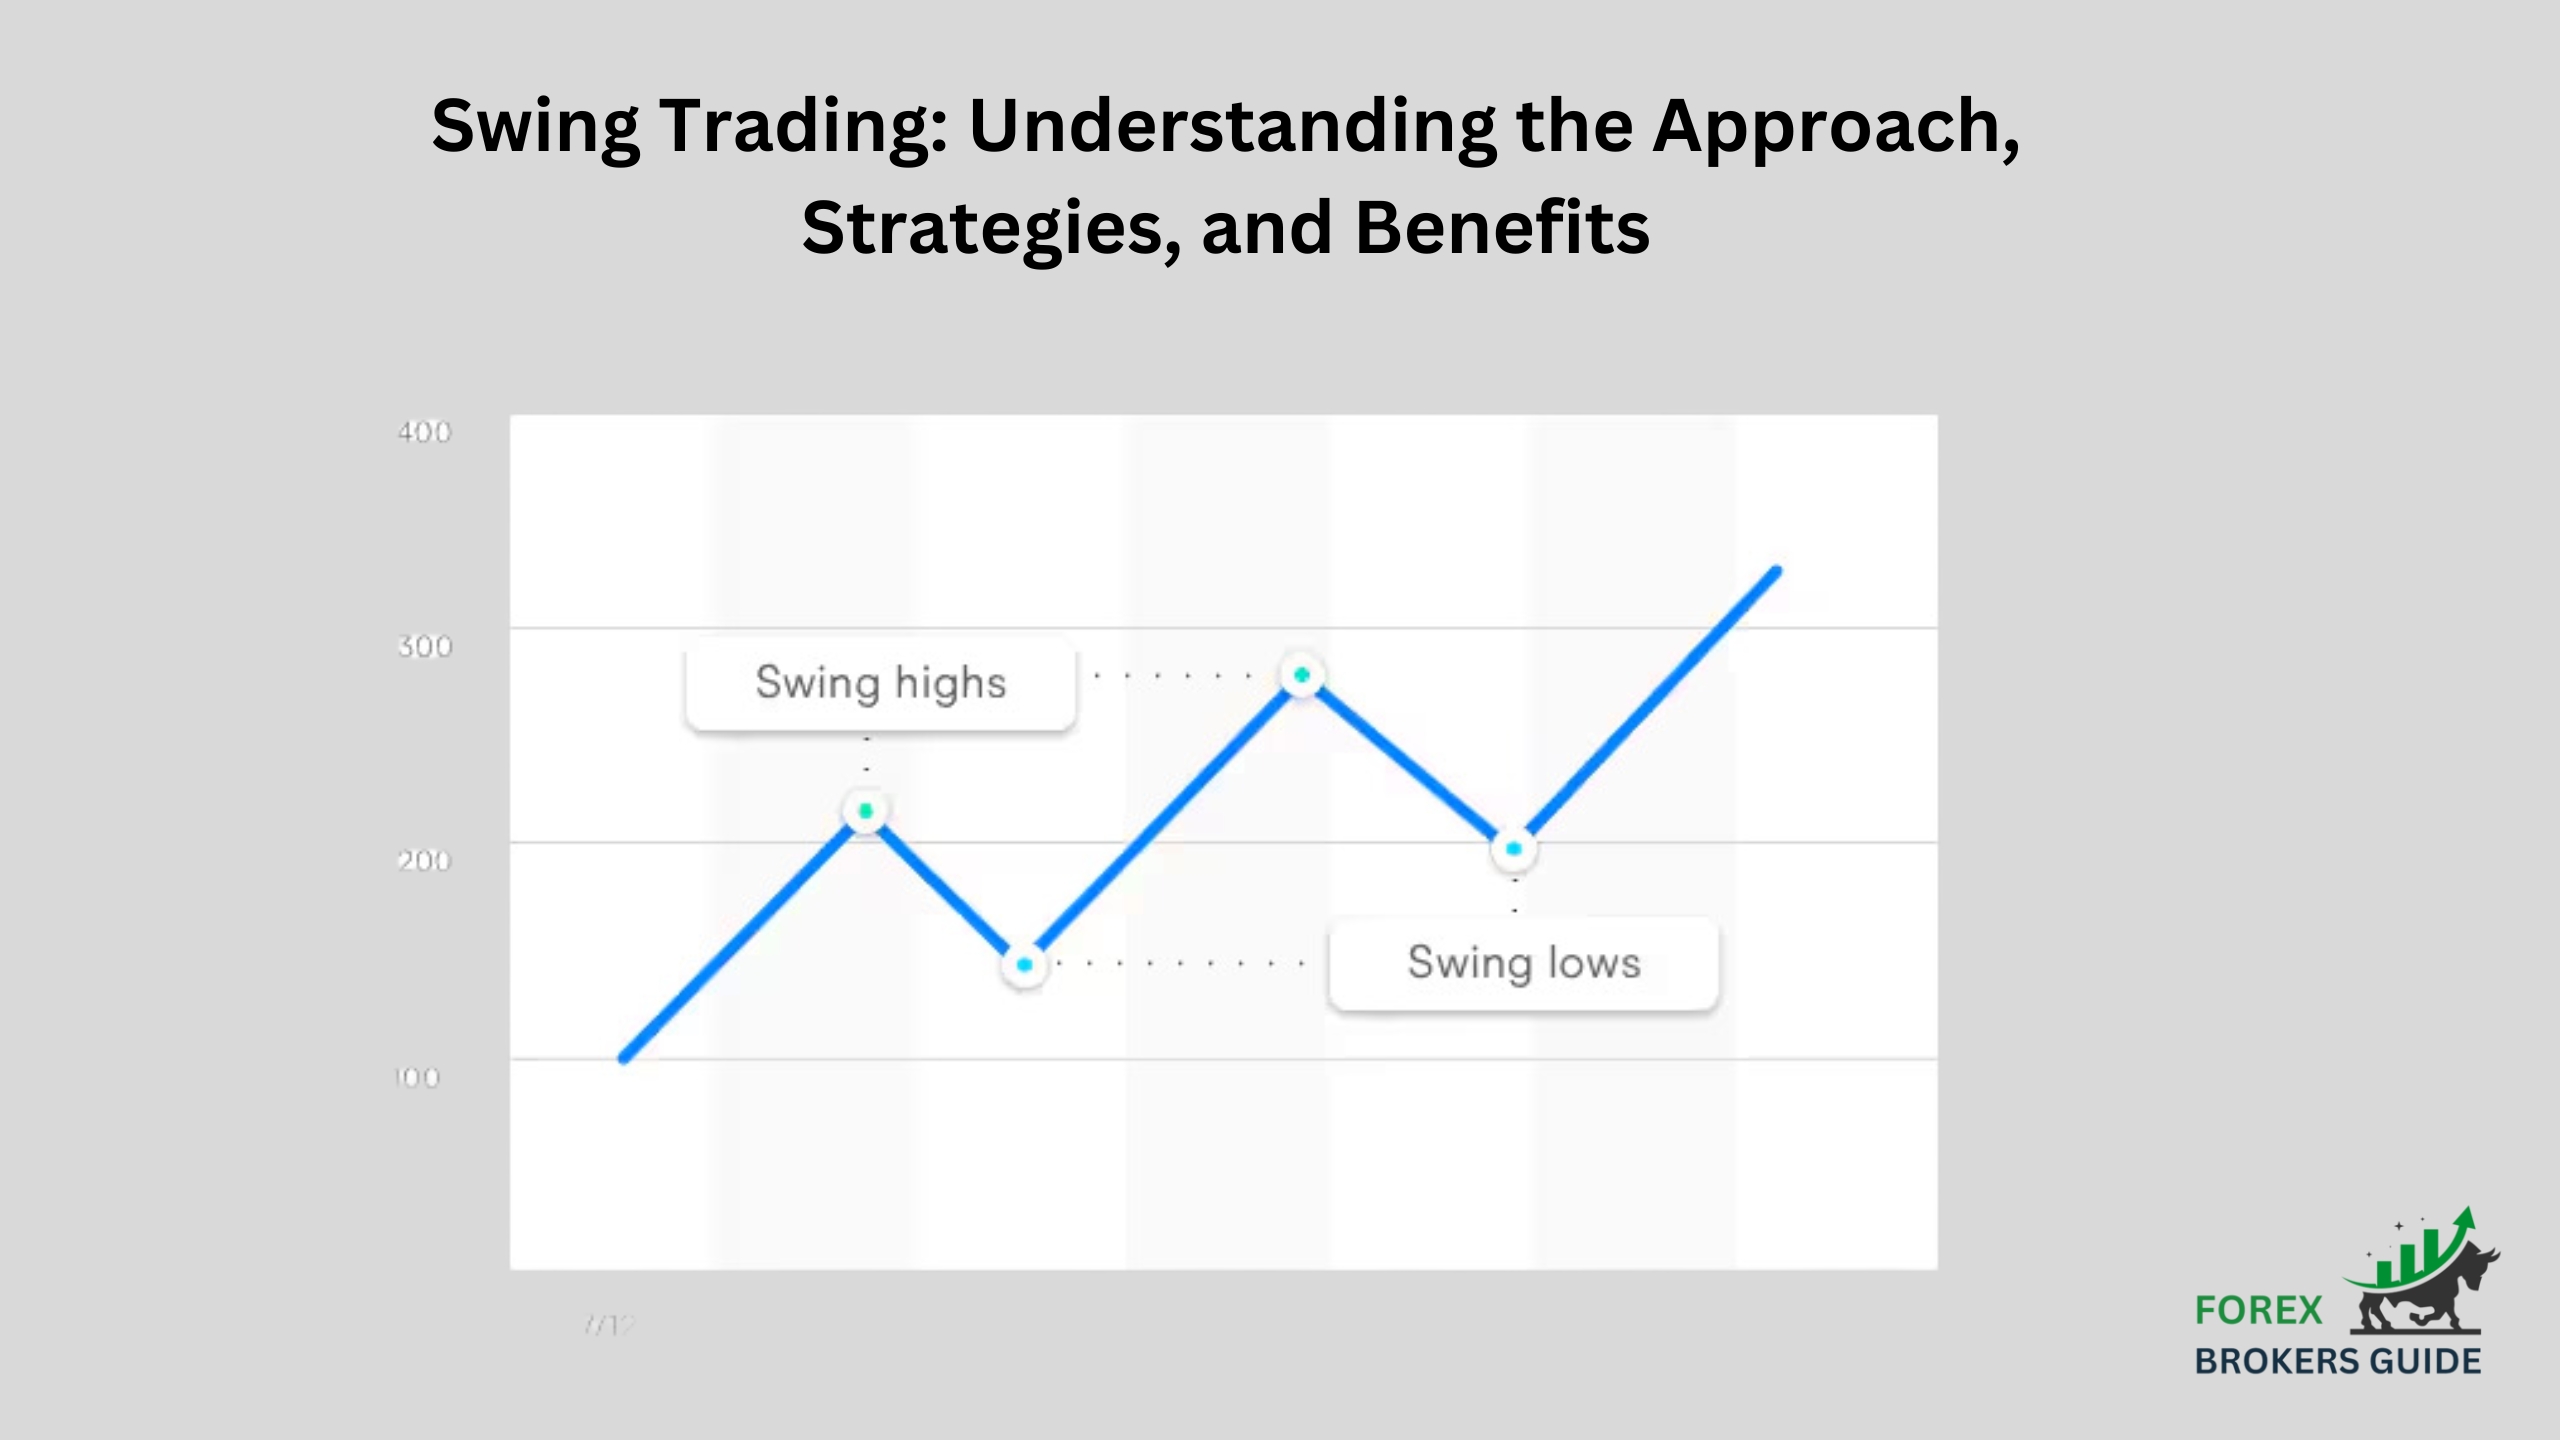
Swing trading is a trading strategy that aims to capture short- to medium-term gains in financial instruments over a period of several days to a few weeks. Swing traders seek to identify and profit from “swings” in the market, which are brief periods of upward or downward price movement.
Unlike day trading, which involves executing multiple trades within a single day, swing trading allows traders to hold positions for a longer period, giving them the opportunity to capitalize on larger price shifts. This strategy relies heavily on technical analysis to determine entry and exit points, using tools like moving averages, Relative Strength Index (RSI), and MACD to make informed decisions. Swing trading can be applied to various financial markets, including stocks, forex, and commodities, and is favored by traders who prefer a less intensive trading approach compared to day trading.
How does Swing Trading differ from Day trading and Long-term Investing?
Swing trading differs from day trading and long-term investing primarily in terms of the time frame and strategy used to achieve profits. Swing trading focuses on capturing short- to medium-term gains over a period of several days to a few weeks. This strategy relies heavily on technical analysis to identify entry and exit points based on market trends and price movements. Swing traders look to profit from the “swings” in the market, holding positions through minor market fluctuations to capitalize on larger price shifts.
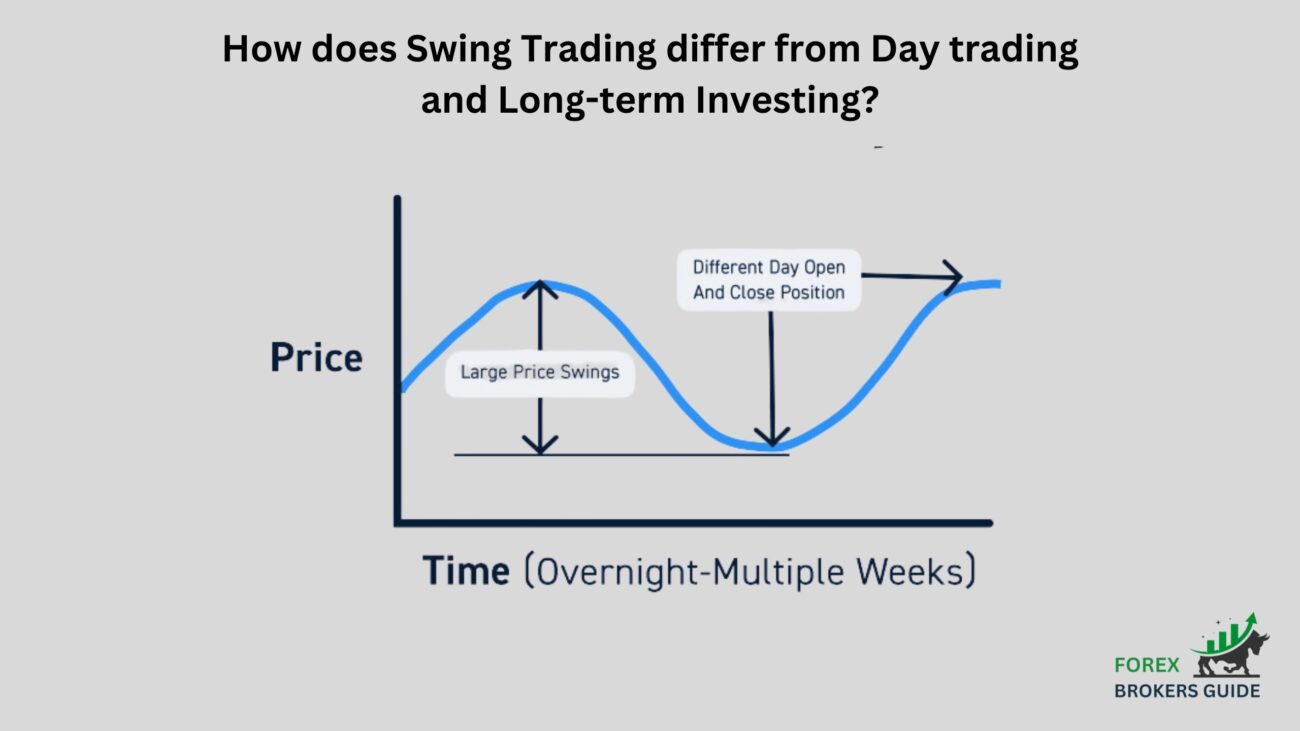
In contrast, day trading involves buying and selling financial instruments within a single trading day. Day traders close all positions before the market closes to avoid overnight risks. This approach requires constant monitoring of the markets, quick decision-making, and often leverages high-frequency trading techniques. Day trading is highly intensive and demands a significant amount of time and focus throughout the trading day.
On the other hand, long-term investing involves holding positions for an extended period, often years. Long-term investors base their decisions primarily on fundamental analysis, assessing the intrinsic value of an asset based on factors such as company performance, economic conditions, and industry trends. This approach aims to build wealth gradually by riding out market volatility and benefiting from the long-term growth of the assets.
Who can benefit from Swing Trading?
Swing trading can benefit a wide range of individuals, particularly those who seek to profit from short- to medium-term market movements without the intense commitment required by day trading. Part-time traders who cannot dedicate their entire day to monitoring the markets can find swing trading particularly appealing. This strategy allows them to analyze the market and execute trades during their free time, typically outside regular working hours.
Investors looking to diversify their portfolio can also benefit from swing trading. By incorporating swing trades into their investment strategy, they can capitalize on short-term price movements while still maintaining their long-term positions. This can enhance overall portfolio performance by adding another layer of potential profit.
Traders with a solid understanding of technical analysis are well-suited for swing trading. The success of swing trading heavily relies on the ability to read and interpret charts, recognize patterns, and use technical indicators such as moving averages, Relative Strength Index (RSI), and MACD to make informed trading decisions. Individuals who enjoy analyzing market trends and price action can leverage their skills to achieve consistent gains.
Risk-averse traders who prefer a less stressful trading approach compared to day trading can also benefit from swing trading. Since swing trading involves holding positions for several days to a few weeks, it allows for more deliberate decision-making and reduces the pressure of making multiple trades within a single day. This can lead to a more balanced trading experience and help mitigate the emotional toll often associated with high-frequency trading.
What are the Fundamentals of Swing Trading?
Swing trading is built on several key fundamentals that guide traders in capturing short- to medium-term gains from market movements. The primary focus of swing trading is to identify and profit from the “swings” in the price of financial instruments, which can occur over a period of several days to a few weeks. Here are the core fundamentals of swing trading:
- Trend Analysis: Identifying the direction of the market trend is crucial in swing trading. Traders look for uptrends, downtrends, or sideways trends to determine their trading strategy. Recognizing the overall market direction helps traders align their trades with the prevailing trend, increasing the likelihood of successful trades.
- Technical Analysis: Swing traders rely heavily on technical analysis to make informed decisions. This involves using charts and technical indicators to analyze price movements and identify potential entry and exit points. Commonly used indicators include moving averages, Relative Strength Index (RSI), MACD, and Bollinger Bands. These tools help traders spot trends, measure momentum, and detect possible reversals.
- Support and Resistance Levels: Understanding support and resistance levels is fundamental to swing trading. Support levels indicate where a price tends to find a floor, while resistance levels signify where a price tends to face obstacles. Swing traders use these levels to determine optimal entry and exit points, as prices often bounce off these levels.
- Risk Management: Effective risk management is essential for protecting capital and ensuring long-term success in swing trading. This includes setting stop-loss orders to limit potential losses and determining appropriate position sizes based on risk tolerance. Risk management strategies help traders minimize losses and maximize profits.
- Entry and Exit Strategies: Developing clear criteria for entering and exiting trades is a fundamental aspect of swing trading. Traders use technical indicators and chart patterns to identify optimal entry points and set profit targets. Exit strategies are equally important and may involve setting take-profit levels or using trailing stops to lock in gains while allowing profits to run.
- Market Conditions: Swing traders must stay informed about overall market conditions and news that could impact price movements. Economic indicators, corporate earnings reports, and geopolitical events can all influence market trends. Being aware of these factors helps traders make better-informed decisions and adjust their strategies accordingly.
- Patience and Discipline: Successful swing trading requires patience and discipline. Unlike day trading, swing trading involves holding positions for several days to weeks, requiring traders to wait for the right opportunities. Sticking to a well-defined trading plan and avoiding emotional decisions are crucial for maintaining discipline.
How does Swing Trading Work?
Swing trading operates by capitalizing on short- to medium-term price movements in financial markets. The primary objective is to capture “swings” in the market, which are upward or downward price movements occurring over a period of several days to a few weeks. Here’s how swing trading works:
Swing traders start by analyzing the market to identify potential trading opportunities. This involves using technical analysis tools and indicators to study price charts and detect trends, patterns, and key levels of support and resistance. Indicators such as moving averages, Relative Strength Index (RSI), MACD, and Bollinger Bands help traders understand market momentum and predict potential price movements.
Once a potential trade is identified, swing traders determine their entry and exit points. An entry point is chosen based on technical signals that indicate the start of a new price swing. For example, a trader might enter a position when the price breaks above a resistance level or when an indicator signals an oversold condition. The exit point is predetermined and can be based on reaching a target price, hitting a resistance level, or other technical signals indicating a possible reversal.
Risk management is a crucial aspect of swing trading. Traders set stop-loss orders to limit potential losses if the market moves against their position. These orders automatically close the trade when the price reaches a specified level, protecting the trader’s capital. Additionally, swing traders determine the appropriate position size for each trade based on their risk tolerance and the potential reward.
Swing trading involves holding positions for a few days to several weeks, depending on how long it takes for the price to move in the desired direction. Unlike day trading, which requires constant monitoring and rapid decision-making within a single day, swing trading allows for more relaxed trade management, as positions are not typically closed on the same day they are opened.
To be successful, swing traders must stay informed about overall market conditions and relevant news that could impact their trades. Economic indicators, corporate earnings reports, and geopolitical events can all influence market trends and price movements. By staying updated, swing traders can make better-informed decisions and adjust their strategies as needed.
What are the Key Concepts in Swing Trading?
Swing trading revolves around several key concepts that help traders identify and capitalize on short- to medium-term market movements. Understanding these concepts is essential for anyone looking to engage in swing trading. Here are the key concepts in swing trading:
- Trend Identification: Recognizing market trends is fundamental to swing trading. Traders look for uptrends, downtrends, or sideways movements to determine their trading strategy. An uptrend is characterized by higher highs and higher lows, while a downtrend features lower highs and lower lows. Sideways trends, or consolidations, occur when the price moves within a narrow range without a clear direction.
- Support and Resistance Levels: Support levels are price points where an asset tends to stop falling and start rising, while resistance levels are points where the price tends to stop rising and start falling. These levels are crucial for swing traders to identify potential entry and exit points. Prices often bounce off these levels, providing opportunities to enter or exit trades.
- Technical Indicators: Swing traders use a variety of technical indicators to analyze price movements and predict future trends. Key indicators include moving averages, which smooth out price data to reveal trends; the Relative Strength Index (RSI), which measures the speed and change of price movements to identify overbought or oversold conditions; and MACD (Moving Average Convergence Divergence), which shows the relationship between two moving averages and helps identify momentum and trend changes.
- Chart Patterns: Recognizing chart patterns is another essential concept in swing trading. Patterns such as head and shoulders, double tops and bottoms, flags, and triangles provide visual cues about potential future price movements. These patterns help traders anticipate market behavior and make strategic trading decisions.
- Risk Management: Effective risk management is crucial to protect trading capital and ensure long-term success. Swing traders set stop-loss orders to limit potential losses if the market moves against their positions. They also use position sizing techniques to manage the amount of capital allocated to each trade, balancing potential rewards with acceptable risk levels.
- Entry and Exit Strategies: Developing clear criteria for entering and exiting trades is fundamental in swing trading. Traders use technical signals and patterns to identify optimal entry points and set predefined exit points to secure profits or limit losses. This disciplined approach helps traders avoid emotional decision-making and stick to their trading plan.
- Market Analysis and News: Staying informed about overall market conditions and relevant news is essential for swing traders. Economic indicators, corporate earnings reports, and geopolitical events can impact market trends and price movements. Being aware of these factors helps traders make better-informed decisions and adjust their strategies as needed.
- Patience and Discipline: Swing trading requires patience and discipline, as trades are held for several days to weeks. Traders must wait for the right opportunities and adhere to their trading plan without being swayed by short-term market fluctuations. This disciplined approach is key to achieving consistent success.
What are the most Effective Swing Trading Strategies?
Swing trading employs various strategies to capture short- to medium-term market movements. These strategies are designed to identify and capitalize on price swings over several days to a few weeks. Here are some of the most effective swing trading strategies:
- Trend Following: Trend following is one of the most popular swing trading strategies. Traders identify and trade in the direction of the prevailing trend, whether it’s an uptrend or a downtrend. Using tools like moving averages, traders can confirm the trend direction and time their entries and exits accordingly. For example, a trader might enter a long position when the price is above a rising moving average and exit when it falls below the average.
- Breakout Trading: Breakout trading involves entering a trade when the price breaks through a key support or resistance level. This strategy aims to capture significant price movements that follow these breakouts. Traders use technical indicators such as Bollinger Bands or volume spikes to identify potential breakouts. For instance, a trader might buy a stock when it breaks above a resistance level with high trading volume, indicating strong buying interest.
- Reversal Trading: Reversal trading focuses on identifying points where the market trend is likely to reverse. This strategy involves looking for overbought or oversold conditions using indicators like the Relative Strength Index (RSI) or Stochastic Oscillator. A trader might enter a short position when the RSI indicates overbought conditions, signaling a potential downward reversal, and exit when the RSI moves back to a neutral level.
- Fibonacci Retracement: This strategy uses Fibonacci retracement levels to identify potential support and resistance levels where price retracements might occur. Traders use these levels to enter trades during a pullback within a trend. For example, in an uptrend, a trader might buy when the price retraces to the 38.2% Fibonacci level, expecting the trend to resume.
- Momentum Trading: Momentum trading involves buying securities that are showing strong upward momentum and selling those with strong downward momentum. Traders use indicators like MACD (Moving Average Convergence Divergence) and the Relative Strength Index (RSI) to identify stocks with strong momentum. This strategy aims to ride the momentum wave until signs of a reversal appear.
- Moving Average Crossover: This strategy involves using two moving averages, typically a short-term and a long-term moving average. A buy signal is generated when the short-term moving average crosses above the long-term moving average, indicating upward momentum. Conversely, a sell signal occurs when the short-term moving average crosses below the long-term moving average. This strategy helps traders identify changes in trend direction.
- Channel Trading: Channel trading involves identifying a price channel and trading within its boundaries. Traders buy at the lower boundary (support) of the channel and sell at the upper boundary (resistance). This strategy works well in range-bound markets where the price moves within a defined range. Technical tools like trendlines and Bollinger Bands can help identify these channels.
How to use Technical Analysis in Swing Trading?
Technical analysis is a cornerstone of swing trading, helping traders make informed decisions by analyzing price movements and market trends. To effectively use technical analysis in swing trading, traders start by examining price charts to identify trends. Recognizing whether the market is in an uptrend, downtrend, or sideways trend is crucial as it guides the trading strategy. In an uptrend, traders look for buying opportunities, while in a downtrend, they seek selling opportunities. Sideways trends often prompt traders to focus on range-bound strategies.
Swing traders rely heavily on various technical indicators to refine their analysis and pinpoint entry and exit points. Moving averages are among the most commonly used tools, providing a smoothed view of price data over a specific period. By plotting short-term and long-term moving averages on a chart, traders can identify crossover points that signal potential trend changes. For example, a bullish signal occurs when a short-term moving average crosses above a long-term moving average, indicating a potential upward movement.
The Relative Strength Index (RSI) is another vital indicator in swing trading. The RSI measures the speed and change of price movements, oscillating between 0 and 100. An RSI above 70 typically indicates overbought conditions, suggesting a possible downward correction, while an RSI below 30 indicates oversold conditions, hinting at a potential upward reversal. Swing traders use these signals to time their entries and exits more precisely.
Bollinger Bands are used to measure market volatility and identify overbought or oversold conditions. Bollinger Bands consist of a middle band (usually a simple moving average) and two outer bands set at a specific standard deviation above and below the middle band. When the price moves close to the upper band, it indicates overbought conditions, while proximity to the lower band suggests oversold conditions. Swing traders use these bands to anticipate potential price reversals and adjust their positions accordingly.
Chart patterns also play a significant role in swing trading. Patterns such as head and shoulders, double tops and bottoms, flags, and triangles provide visual cues about future price movements. Recognizing these patterns helps traders anticipate market behavior and plan their trades strategically. For example, a head and shoulders pattern often signals a bearish reversal, prompting traders to consider short positions.
Support and resistance levels are crucial in swing trading. Support levels are price points where a downtrend is expected to pause due to a concentration of buying interest, while resistance levels are where an uptrend is likely to halt due to selling interest. Identifying these levels helps traders set strategic entry and exit points. For instance, a swing trader might enter a long position near a support level and set a target price just below a resistance level.
Effective risk management is essential when using technical analysis in swing trading. Traders set stop-loss orders to limit potential losses if the market moves against their position. They also determine the appropriate position size based on their risk tolerance and the trade’s potential reward. By integrating these risk management techniques with technical analysis, swing traders can protect their capital and enhance their trading performance.
What are the Best Indicators for Swing Trading?
Swing trading relies heavily on technical indicators to identify potential trading opportunities and make informed decisions. Here are some of the best indicators commonly used in swing trading:
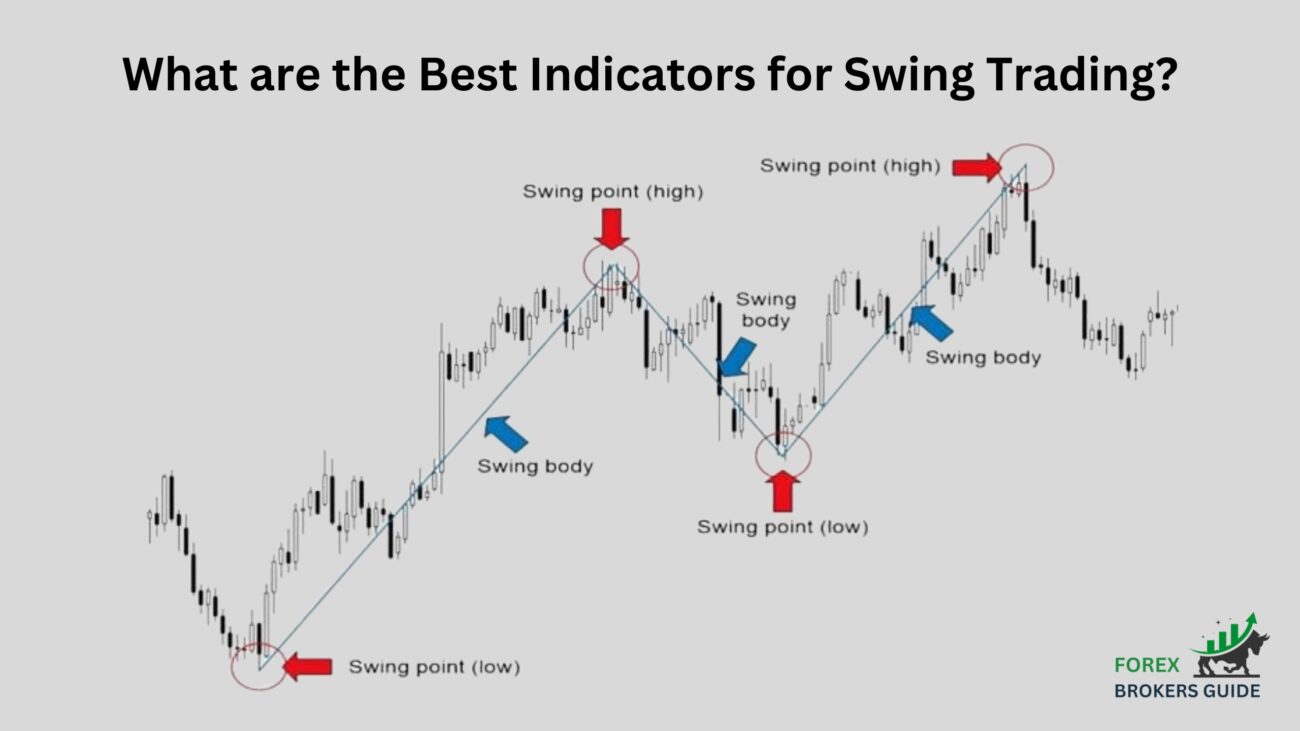
Moving Averages: Moving averages are essential tools for swing traders. They smooth out price data to help identify the direction of the trend. The Simple Moving Average (SMA) and the Exponential Moving Average (EMA) are particularly popular. The SMA calculates the average price over a specific period, while the EMA gives more weight to recent prices, making it more responsive to new information. Traders often use crossover strategies, where a short-term moving average crossing above a long-term moving average signals a potential buy, and a crossover below indicates a potential sell.
Relative Strength Index (RSI): The RSI is a momentum oscillator that measures the speed and change of price movements. It ranges from 0 to 100 and helps identify overbought and oversold conditions. An RSI above 70 typically signals that an asset is overbought and might be due for a pullback, while an RSI below 30 indicates that an asset is oversold and might be poised for a rebound. Swing traders use these signals to time their entries and exits.
MACD (Moving Average Convergence Divergence): The MACD is a trend-following momentum indicator that shows the relationship between two moving averages of a security’s price. The MACD line is the difference between the 12-day and 26-day EMAs, while the signal line is a 9-day EMA of the MACD line. When the MACD line crosses above the signal line, it generates a bullish signal, and when it crosses below, it generates a bearish signal. This helps traders identify changes in the strength, direction, momentum, and duration of a trend.
Bollinger Bands: Bollinger Bands consist of a middle band (usually a 20-day SMA) and two outer bands set two standard deviations above and below the middle band. These bands expand and contract based on market volatility. When the price moves towards the upper band, it indicates overbought conditions, and when it moves towards the lower band, it indicates oversold conditions. Swing traders use Bollinger Bands to identify potential reversal points and gauge market volatility.
Stochastic Oscillator: The stochastic oscillator compares a particular closing price to a range of its prices over a certain period. It ranges from 0 to 100 and helps identify overbought and oversold conditions. Readings above 80 typically indicate overbought conditions, while readings below 20 indicate oversold conditions. This oscillator helps traders identify potential reversal points and time their trades more effectively.
Fibonacci Retracement: Fibonacci retracement levels are used to identify potential support and resistance levels. Traders use these levels to predict where the price might retrace before continuing in the direction of the trend. Common retracement levels include 23.6%, 38.2%, 50%, and 61.8%. By applying these levels to recent price movements, swing traders can identify potential entry and exit points.
Average True Range (ATR): The ATR measures market volatility by calculating the average range between high and low prices over a specific period. Higher ATR values indicate increased volatility, which can present more trading opportunities. Swing traders use ATR to set stop-loss levels and manage risk more effectively.
How to Identify Trends and Reversals in Swing Trading?
Identifying trends and reversals is crucial for successful swing trading. Trends indicate the general direction of the market, while reversals signal a change in that direction. Here’s how traders can identify trends and reversals effectively:
To identify trends, swing traders rely heavily on technical analysis tools such as moving averages. A trend is typically characterized by a series of higher highs and higher lows in an uptrend, or lower highs and lower lows in a downtrend. Moving averages, such as the Simple Moving Average (SMA) and the Exponential Moving Average (EMA), smooth out price data to reveal the direction of the trend. For example, if the price is consistently above a rising 50-day SMA, it indicates an uptrend, whereas a price below a falling 50-day SMA suggests a downtrend.
Another crucial tool for trend identification is the Relative Strength Index (RSI). The RSI measures the speed and change of price movements, oscillating between 0 and 100. An RSI reading above 70 indicates overbought conditions, suggesting that the asset might be due for a downward correction, while an RSI below 30 indicates oversold conditions, suggesting a potential upward movement. Swing traders use these signals to confirm the strength of a trend and anticipate potential reversals.
Chart patterns are also vital in identifying trends and reversals. Patterns such as head and shoulders, double tops and bottoms, and flags provide visual cues about future price movements. For instance, a head and shoulders pattern often signals a bearish reversal in an uptrend, while a double bottom might indicate a bullish reversal in a downtrend. Recognizing these patterns helps traders anticipate changes in the market direction.
Bollinger Bands are used to measure market volatility and identify overbought or oversold conditions, which can precede reversals. Bollinger Bands consist of a middle band (usually a 20-day SMA) and two outer bands set two standard deviations above and below the middle band. When the price moves toward the upper band, it indicates overbought conditions, and when it moves toward the lower band, it indicates oversold conditions. A price breaking out of the bands often signals a trend reversal.
MACD (Moving Average Convergence Divergence) is another powerful tool for identifying trends and reversals. The MACD line, which is the difference between the 12-day and 26-day EMAs, and the signal line, a 9-day EMA of the MACD line, help traders identify changes in the strength, direction, momentum, and duration of a trend. When the MACD line crosses above the signal line, it generates a bullish signal, indicating a potential upward trend. Conversely, a cross below the signal line generates a bearish signal, indicating a potential downward trend.
Swing traders also use Fibonacci retracement levels to identify potential support and resistance levels where reversals might occur. Common retracement levels include 23.6%, 38.2%, 50%, and 61.8%. When the price retraces to one of these levels and then resumes in the direction of the trend, it confirms the continuation of the trend. However, if the price breaks through these levels, it may signal a trend reversal.
How to Manage Risk in Swing Trading?
Effective risk management is crucial for swing trading to protect capital and ensure long-term profitability. Here are key strategies for managing risk in swing trading:
Setting Stop-Loss Orders: One of the most effective ways to manage risk is by setting stop-loss orders. A stop-loss order automatically closes a trade when the price reaches a predetermined level, limiting potential losses. Traders determine the stop-loss level based on their risk tolerance and the volatility of the asset. For example, a trader might set a stop-loss order 5% below the entry price to cap the loss at 5% of the trade value.
Determining Position Size: Proper position sizing is essential to manage risk. Traders calculate the appropriate position size based on the total capital they are willing to risk on a single trade, typically no more than 1-2% of their trading account. This approach ensures that no single trade significantly impacts the overall portfolio. For instance, if a trader has a $50,000 account and is willing to risk 2%, they would risk $1,000 per trade. If their stop-loss is set at 5% below the entry price, the position size should be $20,000 (since $20,000 x 5% = $1,000).
Using Technical Analysis for Entry and Exit Points: Utilizing technical analysis to identify precise entry and exit points can help manage risk by improving the timing of trades. By entering trades at key support levels and exiting at resistance levels or using technical indicators like moving averages and RSI, traders can increase the probability of successful trades and reduce the risk of significant losses.
Diversifying Trades: Diversification involves spreading investments across different assets or sectors to reduce risk. By diversifying, traders can mitigate the impact of a single asset’s poor performance on their overall portfolio. For example, instead of investing all capital in one stock, a trader might spread it across multiple stocks in different industries.
Using Trailing Stops: Trailing stops are dynamic stop-loss orders that move with the price of the asset. As the price moves in the trader’s favor, the trailing stop adjusts to lock in profits while still protecting against reversals. For example, if a trader sets a trailing stop 5% below the market price and the price rises, the stop-loss will move up with the price, maintaining the 5% distance. If the price then falls by 5%, the trade will automatically close, securing the profit.
Regularly Reviewing and Adjusting Trades: Continuous monitoring and adjusting of trades based on market conditions and performance is vital. Traders should regularly review their positions and make necessary adjustments to stop-loss levels, position sizes, or even exit trades early if the market conditions change unfavorably.
Maintaining Emotional Discipline: Emotional discipline is crucial for effective risk management. Traders should stick to their trading plan and avoid making impulsive decisions driven by fear or greed. Following a well-defined strategy and maintaining a calm and rational mindset helps prevent emotional trading mistakes.
Utilizing Risk-Reward Ratios: Calculating the risk-reward ratio for each trade helps traders assess whether the potential reward justifies the risk. A favorable risk-reward ratio, such as 1:3, means that the potential profit is three times the potential loss. By focusing on trades with high risk-reward ratios, traders can improve their overall profitability.
What are the best Practices for Setting Stop-loss Orders in Swing Trading?
Stop-loss orders are essential tools in swing trading for managing risk and protecting capital. Here are the best practices for setting effective stop-loss orders:
Determine the Appropriate Stop-Loss Level: The stop-loss level should be set based on technical analysis, considering key support and resistance levels. For example, placing a stop-loss just below a significant support level for long positions or just above a resistance level for short positions helps ensure that the stop is set at a logical point where the price is less likely to move.
Use Percentage-Based Stops: A common method is to set stop-loss orders at a fixed percentage of the entry price. This percentage should align with your risk tolerance and trading strategy. For instance, if you set a 5% stop-loss on a stock bought at $100, the stop-loss would be placed at $95. This approach helps manage risk by limiting potential losses to a predetermined percentage.
Employ Average True Range (ATR): The Average True Range (ATR) measures market volatility and can help determine an appropriate stop-loss level. A higher ATR indicates greater volatility, so the stop-loss should be set further from the entry point to avoid being prematurely stopped out by normal price fluctuations. For example, if the ATR is $2, you might set your stop-loss 1.5 times the ATR below the entry price, or $3.
Set Stops Based on Chart Patterns: Utilizing chart patterns such as head and shoulders, double tops and bottoms, or flags can guide where to place stop-loss orders. For instance, if you enter a trade based on a breakout from a consolidation pattern, placing the stop-loss just below the breakout point helps protect against false breakouts.
Use Trailing Stops: Trailing stops move with the price, maintaining a set distance below (for long positions) or above (for short positions) the market price. This allows you to lock in profits as the price moves in your favor while still providing a safety net if the price reverses. For example, if you set a trailing stop 5% below the market price and the price rises, the stop-loss will adjust upward to maintain the 5% distance.
Adjust Stop-Loss Levels Over Time: As the trade progresses and the price moves in your favor, consider adjusting the stop-loss level to lock in profits. This technique, known as “trailing up” the stop-loss, helps protect gains while allowing for further upside potential.
Avoid Setting Stops Too Tight: Placing stop-loss orders too close to the entry price can result in being stopped out by normal market noise. Ensure that your stop-loss allows for reasonable market fluctuations while still protecting your capital. This balance helps avoid unnecessary exits from potentially profitable trades.
Consider Time-Based Stops: Implementing time-based stops can also be effective. For example, if a trade has not moved as expected within a certain time frame, you might exit the position to free up capital for other opportunities. This approach helps manage the risk of holding onto stagnant positions.
Regularly Review and Adjust: Continuously review your stop-loss levels and adjust them based on changes in market conditions and new technical analysis. Staying flexible and responsive to market developments ensures that your stop-loss orders remain effective.
Maintain Emotional Discipline: Stick to your predefined stop-loss levels and avoid moving them impulsively due to emotional reactions. Emotional discipline is crucial in ensuring that stop-loss orders effectively manage risk and protect your trading capital.
How to determine Position Size in Swing Trading?
Determining the correct position size is a crucial aspect of swing trading as it helps manage risk and optimize potential returns. Here are the steps to determine the appropriate position size:
Assess Your Risk Tolerance: Start by determining how much of your trading capital you are willing to risk on a single trade. A common rule of thumb is to risk no more than 1-2% of your total trading capital on any given trade. This approach helps protect your capital from significant losses and ensures that no single trade can drastically impact your overall portfolio.
Calculate the Dollar Risk: Once you’ve established your risk tolerance, calculate the dollar amount you are willing to risk per trade. For example, if you have a $50,000 trading account and decide to risk 2% per trade, your dollar risk per trade would be $1,000 ($50,000 x 2% = $1,000).
Determine Your Stop-Loss Level: Use technical analysis to determine where to place your stop-loss order. The stop-loss level should be set at a logical point where the trade thesis is invalidated, such as just below a support level for long positions or just above a resistance level for short positions. Calculate the distance between your entry price and the stop-loss level to determine the potential loss per share or unit.
Calculate the Position Size: To calculate the position size, divide your dollar risk by the per-share dollar risk (the distance between the entry price and the stop-loss level). This will give you the number of shares or units to trade. For example, if your dollar risk per trade is $1,000 and the distance between your entry price and stop-loss level is $5, your position size would be 200 shares ($1,000 / $5 = 200 shares).
Use the Risk-Reward Ratio: Ensure that the potential reward of the trade justifies the risk. A favorable risk-reward ratio, such as 1:3, means that the potential profit is three times the potential loss. If the trade doesn’t meet your risk-reward criteria, it’s wise to reconsider or adjust your position size accordingly.
Adjust for Volatility: Consider the volatility of the asset when determining position size. More volatile assets may require smaller position sizes to manage risk effectively. Use the Average True Range (ATR) indicator to gauge volatility. A higher ATR suggests greater volatility, so you may need to reduce your position size to stay within your risk tolerance.
Account for Leverage: If you’re using leverage, factor it into your position size calculation. Leverage can amplify both gains and losses, so it’s crucial to adjust your position size to ensure that the leveraged position doesn’t exceed your risk tolerance. For example, if you’re using 2:1 leverage, a $1,000 risk should be treated as if you’re risking $2,000 of your own capital.
Regularly Review and Adjust: Continuously review your position size calculations and adjust them based on changes in your trading capital, risk tolerance, and market conditions. Staying flexible and responsive ensures that your position sizes remain appropriate for your overall risk management strategy.
Maintain Emotional Discipline: Stick to your calculated position sizes and avoid increasing your position size impulsively due to emotional reactions or market excitement. Emotional discipline is crucial to maintaining consistent risk management practices.
What are the Best trading Platforms for Swing Trading?
The best trading platforms for swing trading offer a combination of advanced charting tools, technical indicators, fast execution speeds, and user-friendly interfaces. MetaTrader 4 (MT4) and MetaTrader 5 (MT5) are highly popular due to their robust charting capabilities, extensive range of technical indicators, and support for automated trading. Thinkorswim by TD Ameritrade provides comprehensive trading tools, real-time data, and an intuitive interface, making it a favorite among swing traders.
TradingView is renowned for its powerful charting features and social networking capabilities, allowing traders to share ideas and strategies. Interactive Brokers (IBKR) offers access to a wide range of markets and professional-grade tools, ideal for experienced traders. TradeStation is another excellent platform known for its advanced analytics, customizable interface, and powerful trading tools. Each of these platforms supports swing trading effectively, helping traders analyze the market, execute trades efficiently, and manage their positions with ease.
What tools are essential for Swing Traders?
The best trading platforms for swing trading offer a combination of advanced charting tools, technical indicators, fast execution speeds, and user-friendly interfaces. MetaTrader 4 (MT4) and MetaTrader 5 (MT5) are highly popular due to their robust charting capabilities, extensive range of technical indicators, and support for automated trading. Thinkorswim by TD Ameritrade provides comprehensive trading tools, real-time data, and an intuitive interface, making it a favorite among swing traders.
TradingView is renowned for its powerful charting features and social networking capabilities, allowing traders to share ideas and strategies. Interactive Brokers (IBKR) offers access to a wide range of markets and professional-grade tools, ideal for experienced traders. TradeStation is another excellent platform known for its advanced analytics, customizable interface, and powerful trading tools. Each of these platforms supports swing trading effectively, helping traders analyze the market, execute trades efficiently, and manage their positions with ease.
How to use Charting Tools for Swing Trading?
Using charting tools effectively is crucial for successful swing trading as they help traders analyze market trends, identify trading opportunities, and make informed decisions. Here’s how to use charting tools for swing trading:
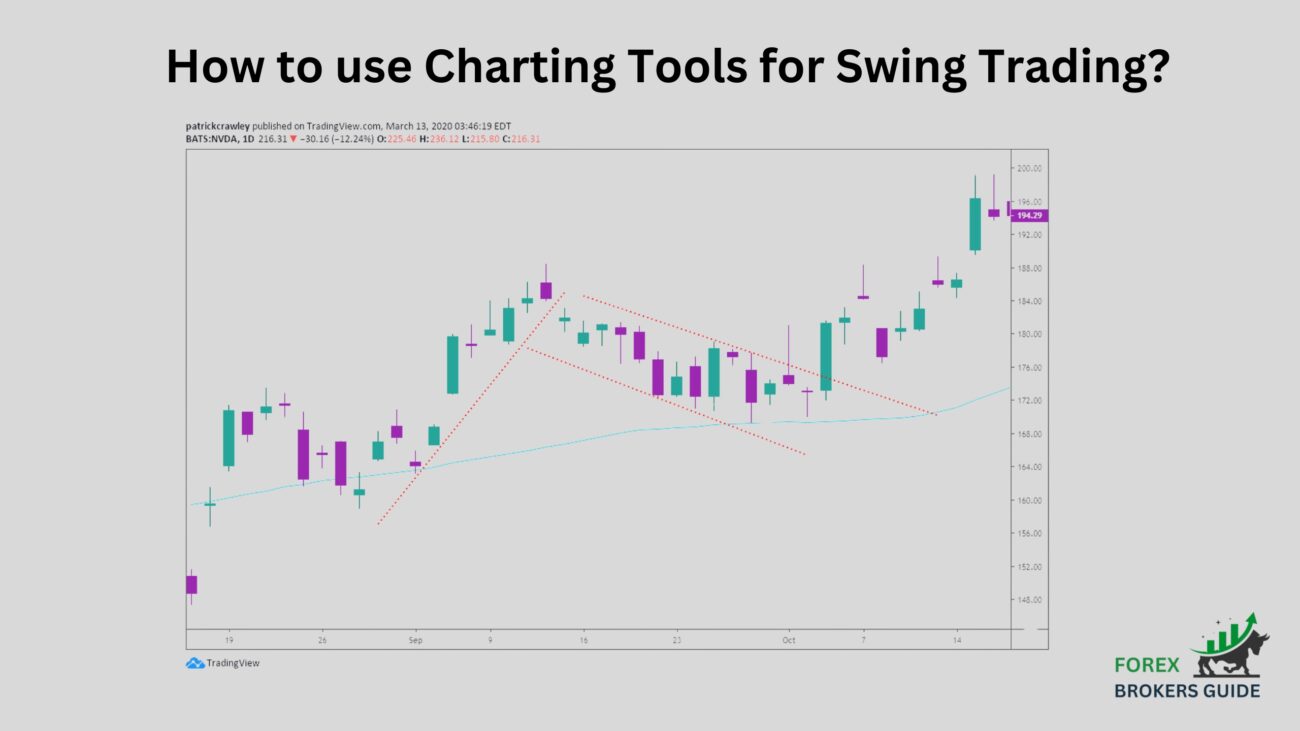
Choose the Right Chart Type: Start by selecting the appropriate chart type for your analysis. Candlestick charts are particularly popular among swing traders because they provide detailed information about price movements, including opening, closing, high, and low prices. Line charts and bar charts are also useful for visualizing trends over time.
Identify Trends: Use charting tools to identify the direction of the market. Trendlines can be drawn on the charts to connect significant highs and lows, helping to visualize the trend direction. An uptrend is characterized by higher highs and higher lows, while a downtrend features lower highs and lower lows.
Apply Technical Indicators: Incorporate technical indicators to gain deeper insights into market conditions. Moving averages, such as the Simple Moving Average (SMA) and the Exponential Moving Average (EMA), help smooth out price data and identify trend directions. The Relative Strength Index (RSI) measures the speed and change of price movements to identify overbought and oversold conditions, signaling potential reversals. Bollinger Bands measure market volatility and can indicate overbought or oversold conditions when prices touch or move outside the bands.
Analyze Chart Patterns: Look for chart patterns that indicate potential trading opportunities. Patterns such as head and shoulders, double tops and bottoms, flags, and triangles provide visual cues about future price movements. Recognizing these patterns helps traders anticipate market behavior and plan their trades accordingly.
Set Support and Resistance Levels: Identify key support and resistance levels on the chart. Support levels are price points where the price tends to find a floor and bounce back up, while resistance levels are where the price tends to hit a ceiling and fall back down. These levels help determine optimal entry and exit points for trades.
Utilize Fibonacci Retracement: Use Fibonacci retracement levels to identify potential support and resistance levels during price corrections within a trend. Common retracement levels include 23.6%, 38.2%, 50%, and 61.8%. These levels help traders identify potential entry points during pullbacks and exits during rallies.
Monitor Volume: Analyze trading volume alongside price movements to confirm trends and reversals. High volume often accompanies significant price moves, indicating strong market interest. Volume analysis helps validate the strength of a trend and potential breakout or reversal points.
Adjust Time Frames: Switch between different time frames to gain a broader perspective on market trends and price movements. While daily charts are commonly used in swing trading, looking at weekly charts can provide a longer-term perspective, and shorter time frames like 4-hour or hourly charts can offer more detailed insights for precise entry and exit points.
What are the Advantages of Swing Trading?
Swing trading offers several advantages that make it an appealing strategy for many traders. One of the primary benefits is the ability to capitalize on short- to medium-term price movements, allowing traders to take advantage of market swings without the need to constantly monitor the market as in day trading. This makes swing trading suitable for individuals who may have other commitments and cannot dedicate their entire day to trading.
Swing trading typically involves holding positions for several days to a few weeks, which can lead to significant gains from price swings. This approach allows traders to benefit from both bullish and bearish market conditions by taking long and short positions, respectively. The potential for higher returns compared to longer-term investing is a key advantage, as swing traders aim to capture substantial price movements over a relatively short period.
Another advantage of swing trading is the reliance on technical analysis, which can be more straightforward and less time-consuming than the fundamental analysis required for long-term investing. Swing traders use charts, patterns, and technical indicators to make informed decisions, which can be easier to learn and apply compared to analyzing company financials and economic conditions.
Swing trading also involves fewer transactions than day trading, which can reduce transaction costs and minimize the impact of trading fees on overall profitability. This can be particularly beneficial for traders with smaller accounts, as lower costs help preserve capital.
Moreover, swing trading allows for more flexibility and can be less stressful than day trading. Since positions are held for a longer period, traders do not need to make rapid-fire decisions and can take the time to analyze and plan their trades more thoroughly. This can lead to a more balanced approach to trading and help maintain emotional control, which is crucial for long-term success.
How does Swing Trading fit into a Balanced Investment Strategy?
Swing trading can play a vital role in a balanced investment strategy by providing opportunities to capitalize on short- to medium-term market movements, complementing longer-term investment positions. Incorporating swing trading into a broader investment portfolio allows for diversification, which can enhance overall returns and reduce risk.
In a balanced investment strategy, long-term investments, such as stocks, bonds, or mutual funds, are typically held for several years to benefit from capital appreciation, dividends, and interest. These investments are chosen based on fundamental analysis, focusing on the financial health and growth potential of companies or assets. Long-term investments provide stability and a steady growth foundation for the portfolio.
Swing trading, on the other hand, aims to take advantage of shorter-term price swings in the market. By identifying and capitalizing on these movements, swing traders can generate additional income and boost portfolio returns without relying solely on the long-term appreciation of assets. This approach allows investors to profit from both rising and falling markets, as swing trading involves taking long and short positions.
The inclusion of swing trading in an investment strategy can also improve portfolio liquidity. Since swing trades are held for shorter durations, the capital used in these trades is more readily available compared to long-term investments. This liquidity can be advantageous in responding to market opportunities or unexpected financial needs.
Moreover, swing trading can serve as a hedge against market volatility. When long-term investments are underperforming due to market downturns, successful swing trading can offset some of these losses by profiting from the short-term price movements. This can help smooth out portfolio performance and reduce the overall impact of market fluctuations.
Incorporating swing trading requires a disciplined approach and a well-defined trading plan. Investors should allocate a portion of their capital specifically for swing trading, separate from their long-term investment funds. This allocation ensures that the risk associated with swing trading does not adversely affect the stability of the overall portfolio.
Swing trading also complements other investment strategies by providing active engagement with the markets. Investors who enjoy analyzing market trends and making informed trading decisions can find swing trading a rewarding and intellectually stimulating addition to their investment activities.
What are the Potential returns from Swing Trading?
The potential returns from swing trading can be significant, depending on various factors such as market conditions, trading skills, and risk management. Swing traders aim to capture short- to medium-term price movements, typically holding positions for several days to a few weeks. Successful swing traders can achieve returns ranging from 5% to 20% per trade, although this varies widely based on individual strategies and market volatility.
Consistent application of effective swing trading strategies can lead to annual returns that outperform traditional long-term investment approaches. However, it’s important to note that potential returns come with associated risks, and not all trades will be profitable. Therefore, robust risk management and disciplined trading are crucial to maximizing returns and minimizing losses in swing trading.
Swing trading vs. Day Trading: Which is better?
The choice between swing trading and day trading depends on individual preferences, time commitment, and risk tolerance. Swing trading involves holding positions for several days to a few weeks, aiming to profit from short- to medium-term price movements. It is suitable for those who cannot monitor the markets continuously and prefer a less intensive trading approach. Swing traders rely on technical analysis and can benefit from larger price swings, often experiencing lower transaction costs due to fewer trades.
Day trading, on the other hand, involves buying and selling financial instruments within the same trading day, often making multiple trades throughout the day. Day traders seek to capitalize on small price movements and require constant market monitoring, quick decision-making, and significant time commitment. This approach can be highly profitable due to the high frequency of trades, but it also comes with higher transaction costs and greater stress.
Swing Trading vs. Long-term Investing: Pros and cons
Swing trading and long-term investing are two distinct approaches to profiting from financial markets, each with its own advantages and disadvantages.
Swing Trading: Pros:
- Shorter Time Frame: Swing trading involves holding positions for several days to a few weeks, allowing for quicker potential profits.
- Flexibility: It offers the ability to capitalize on both rising and falling markets by taking long and short positions.
- Technical Analysis: Relies heavily on technical analysis, which can be easier to learn and apply compared to fundamental analysis.
- Lower Holding Costs: Reduced exposure to long-term market risks such as economic downturns and interest rate changes.
Cons:
- Higher Transaction Costs: Frequent trading can lead to higher commission fees and trading costs.
- Increased Risk: The shorter time frame can lead to higher volatility and the potential for significant short-term losses.
- Time Commitment: Requires regular market analysis and monitoring, which can be demanding.
Long-Term Investing: Pros:
- Lower Stress: Less frequent trading reduces the need for constant market monitoring, leading to lower stress levels.
- Compound Growth: Benefits from the power of compounding returns over time, potentially leading to significant wealth accumulation.
- Dividend Income: Long-term investors can earn regular income through dividends from stocks.
- Lower Transaction Costs: Fewer trades result in lower commission fees and trading costs.
Cons:
- Longer Time Horizon: Requires patience as returns are realized over years or decades.
- Market Risk: Exposed to long-term market risks such as economic downturns, political changes, and interest rate fluctuations.
- Dependence on Fundamental Analysis: Relies on in-depth analysis of company fundamentals and economic conditions, which can be complex and time-consuming.
How to choose between swing trading and other trading methods?
Choosing between swing trading and other trading methods, such as day trading, long-term investing, and scalping, depends on various factors including your financial goals, risk tolerance, time commitment, and trading style. Here’s how to decide which method might be best for you:
1. Assess Your Financial Goals:
- Swing Trading: Ideal for those seeking to capitalize on short- to medium-term price movements over several days to a few weeks.
- Day Trading: Suitable for those looking for daily profits by executing multiple trades within a single trading day.
- Long-Term Investing: Best for individuals aiming for steady growth over several years or decades.
- Scalping: Perfect for traders seeking to make numerous small profits throughout the day by holding positions for a few seconds to minutes.
2. Evaluate Your Risk Tolerance:
- Swing Trading: Involves moderate risk with exposure to market volatility over days or weeks.
- Day Trading: Higher risk due to the need for quick decision-making and frequent trades.
- Long-Term Investing: Generally lower risk over the long term but subject to market downturns and economic cycles.
- Scalping: Very high risk due to the sheer volume of trades and the need for precision in execution.
3. Consider Your Time Commitment:
- Swing Trading: Requires regular but not constant market monitoring, suitable for those with limited daily availability.
- Day Trading: Demands full-time attention and the ability to monitor the market throughout the trading day.
- Long-Term Investing: Minimal daily monitoring, with more focus on periodic review and adjustments.
- Scalping: Requires intense focus and quick reflexes, with constant monitoring throughout the trading session.
4. Determine Your Trading Style:
- Swing Trading: Relies heavily on technical analysis and chart patterns to make informed decisions.
- Day Trading: Combines technical analysis with real-time data and rapid execution.
- Long-Term Investing: Based on fundamental analysis, assessing company performance, and economic trends.
- Scalping: Utilizes high-frequency trading strategies, often employing algorithms and automated systems.
5. Understand Your Market Knowledge and Skills:
- Swing Trading: Suitable for those with a good understanding of technical analysis and market trends.
- Day Trading: Requires in-depth knowledge of market mechanics, quick decision-making skills, and familiarity with trading platforms.
- Long-Term Investing: Best for those comfortable with fundamental analysis and a long-term perspective on market trends.
- Scalping: Demands expertise in technical analysis, quick decision-making, and often access to advanced trading tools and platforms.
6. Evaluate Your Psychological Comfort:
- Swing Trading: Balances the need for active trading with the patience required to hold positions over several days.
- Day Trading: Suitable for those who thrive in a fast-paced, high-pressure environment.
- Long-Term Investing: Best for individuals who prefer a more hands-off approach and can withstand market fluctuations.
- Scalping: Ideal for those who are comfortable with high-frequency trading and can maintain focus and discipline throughout the day.
How to Create a Swing Trading Plan?
Creating a swing trading plan is essential for achieving consistent success and managing risk effectively. Here’s how to develop a comprehensive swing trading plan:
Define Your Trading Goals: Clearly outline your financial objectives, such as desired monthly or annual returns. Set specific, measurable, attainable, relevant, and time-bound (SMART) goals to keep you focused and motivated. Having clear goals helps you stay on track and measure your progress over time.
Select Your Trading Strategy: Choose a swing trading strategy that aligns with your goals and risk tolerance. Common strategies include trend following, breakout trading, and reversal trading. Ensure the strategy suits your trading style and market conditions. A well-chosen strategy provides a framework for making informed trading decisions.
Determine Your Risk Management Rules: Decide how much of your trading capital you are willing to risk on each trade, typically 1-2% of your total account value. Set clear stop-loss levels to limit potential losses and protect your capital. Effective risk management is crucial for preserving your trading capital and sustaining long-term success.
Identify Entry and Exit Criteria: Use technical analysis to establish criteria for entering and exiting trades. This may include specific indicators, chart patterns, or support and resistance levels. Define your profit targets and exit strategies to lock in gains and manage risk. Having clear entry and exit criteria helps you make objective decisions and avoid emotional trading.
Choose the Right Trading Tools and Platforms: Select a reliable trading platform that offers advanced charting tools, technical indicators, and fast execution speeds. Platforms like MetaTrader 4 (MT4), Thinkorswim, and TradingView are popular choices. Utilize additional tools such as stock screeners and news feeds to stay informed about market conditions. The right tools can enhance your analysis and execution.
Establish a Routine: Develop a daily or weekly routine for analyzing the market, placing trades, and reviewing your performance. Allocate specific times for these activities to ensure consistency and discipline. A structured routine helps you stay organized and focused on your trading activities.
Keep a Trading Journal: Maintain a detailed record of all your trades, including entry and exit points, the rationale behind each trade, and the outcomes. Regularly review your journal to identify patterns, learn from mistakes, and refine your strategy. A trading journal is an invaluable tool for continuous improvement and self-assessment.
Stay Informed and Educated: Continuously update your knowledge of the markets and swing trading techniques through courses, webinars, books, and trading communities. Stay informed about economic indicators, corporate earnings reports, and other news that could impact your trades. Ongoing education and market awareness are key to adapting and thriving in changing market conditions.
Monitor and Adjust Your Plan: Regularly assess your trading plan’s effectiveness by comparing your performance against your goals. Be willing to make adjustments to your strategy, risk management rules, or routine as needed to improve your results. Flexibility and responsiveness ensure that your plan remains relevant and effective.
Maintain Emotional Discipline: Stick to your trading plan and avoid making impulsive decisions based on emotions such as fear or greed. Develop techniques to manage stress and maintain a calm, focused mindset. Emotional discipline is crucial for executing your plan consistently and achieving long-term success.
What Elements should be included in a Swing Trading Plan?
A comprehensive swing trading plan is crucial for guiding your trading activities, managing risk, and achieving consistent success. Here are the key elements that should be included:
1. Trading Goals: Define clear, realistic trading goals. Specify your desired monthly or annual returns and set specific, measurable, attainable, relevant, and time-bound (SMART) goals. This will help you stay focused and track your progress.
2. Trading Strategy: Outline your chosen swing trading strategy. Whether it’s trend following, breakout trading, or reversal trading, detail the specific criteria and technical indicators you will use to identify trading opportunities. Ensure your strategy aligns with your risk tolerance and market conditions.
3. Risk Management Rules: Establish strict risk management rules. Decide how much capital you are willing to risk on each trade, typically no more than 1-2% of your total trading capital. Set clear stop-loss levels to limit potential losses and protect your capital.
4. Entry and Exit Criteria: Clearly define the conditions for entering and exiting trades. Use technical analysis tools such as moving averages, Relative Strength Index (RSI), and support and resistance levels to determine optimal entry points. Set predefined exit points, including profit targets and stop-loss levels, to lock in gains and manage risk.
5. Trading Tools and Platforms: Specify the trading platform and tools you will use. Choose a reliable platform that offers advanced charting tools, technical indicators, and fast execution speeds. Platforms like MetaTrader 4 (MT4), Thinkorswim, and TradingView are popular choices among swing traders. Utilize additional tools such as stock screeners and news feeds to stay informed about market conditions.
6. Routine and Schedule: Establish a routine for your trading activities. Determine when you will analyze the market, place trades, and review your performance. Allocating specific times for these activities helps ensure consistency and discipline in your trading approach.
7. Trading Journal: Include a section on maintaining a detailed trading journal. Document all your trades, including entry and exit points, the rationale behind each trade, and the outcomes. Regularly reviewing your journal helps identify patterns, learn from mistakes, and refine your strategy.
8. Market Analysis and News Monitoring: Plan how you will stay informed about market trends, economic indicators, corporate earnings reports, and other news that could impact your trades. Staying updated with relevant information is crucial for making informed trading decisions.
9. Performance Evaluation: Outline how you will assess the effectiveness of your trading plan. Regularly compare your performance against your goals, identify what is working well, and determine areas for improvement. Be willing to make adjustments to your strategy, risk management rules, or routine as needed.
10. Emotional Control and Discipline: Include strategies for maintaining emotional control and discipline while trading. Stick to your trading plan, avoid impulsive decisions based on emotions like fear or greed, and develop techniques to manage stress and maintain a calm, focused mindset.
How to stay disciplined with your Swing Trading Plan?
Staying disciplined with your swing trading plan is essential for achieving consistent success and managing risk effectively. One of the key aspects of maintaining discipline is adhering strictly to your predefined trading strategy and rules. This means entering and exiting trades based on the criteria outlined in your plan, rather than making impulsive decisions driven by emotions such as fear or greed. Developing a structured routine for market analysis, trade execution, and performance review helps reinforce this discipline. Allocating specific times for these activities ensures that you approach trading methodically, rather than haphazardly.
Maintaining a detailed trading journal is another crucial practice for staying disciplined. By documenting each trade, including the rationale behind it, the entry and exit points, and the outcome, you create a record that can be analyzed to identify patterns and areas for improvement. Regularly reviewing your trading journal helps you learn from past mistakes and successes, which in turn reinforces disciplined behavior and adherence to your plan.
Risk management is a cornerstone of disciplined trading. Always set stop-loss orders according to your plan’s guidelines and never move them impulsively. Proper position sizing, based on your risk tolerance and the specific trade setup, ensures that no single trade can significantly impact your overall portfolio. This approach not only protects your capital but also promotes a disciplined mindset by preventing overexposure to any one position.
Continuous education and staying informed about market conditions are also vital. By regularly updating your knowledge and understanding of the markets, you can make better-informed decisions and avoid the pitfalls of trading based on outdated information or assumptions. Engaging with trading communities, attending webinars, and reading relevant books and articles can keep you sharp and committed to your plan.
Emotional control is perhaps the most challenging aspect of maintaining discipline. Developing techniques to manage stress, such as mindfulness meditation, deep breathing exercises, or regular physical activity, can help keep your emotions in check. Having a clear set of rules and a structured approach reduces the likelihood of emotional trading, helping you stick to your plan even in volatile market conditions.
What are the Common Mistakes to avoid in Swing Trading?
Swing trading can be highly profitable, but it also comes with its own set of challenges. Avoiding common mistakes is crucial for achieving long-term success. One frequent error is failing to adhere to a trading plan. Traders often develop a plan but then deviate from it due to emotional impulses, such as fear or greed. Sticking strictly to your predefined strategy and risk management rules is essential for maintaining discipline and consistency.
Another common mistake is improper risk management. Swing traders may either risk too much capital on a single trade or neglect to set stop-loss orders, leading to significant losses. Always use stop-loss orders and ensure that no single trade can drastically impact your overall portfolio. Risking only a small percentage of your trading capital per trade (typically 1-2%) is a prudent approach.
Overtrading is another pitfall to avoid. Swing traders might enter too many trades, often due to impatience or the desire to quickly recover losses. Overtrading can lead to increased transaction costs and reduced focus on high-quality trading opportunities. Instead, be selective and ensure each trade aligns with your strategy and offers a favorable risk-reward ratio.
Ignoring market conditions is also a common mistake. Swing traders sometimes fail to adapt to changing market environments, such as shifts from trending to range-bound markets. Regularly review and adjust your strategy based on current market conditions to ensure it remains effective.
Lack of technical analysis proficiency can lead to poor trading decisions. Swing trading relies heavily on technical analysis, so it’s important to understand and correctly apply various indicators, chart patterns, and support and resistance levels. Continuous learning and practice are key to honing your technical analysis skills.
Emotional trading is a major obstacle. Allowing emotions like fear, greed, or impatience to dictate your trades can result in poor decision-making and significant losses. Develop techniques to manage stress and maintain emotional control, such as mindfulness practices, regular exercise, or taking breaks from trading when needed.
Finally, neglecting to keep a trading journal can hinder your ability to learn from past trades. Documenting every trade, including your rationale, entry and exit points, and outcomes, allows you to review and identify patterns, strengths, and weaknesses in your trading strategy. Regularly reviewing your trading journal is a valuable practice for continuous improvement.
How to Learn from Mistakes in Swing Trading?
To learn from mistakes in swing trading, start by maintaining a detailed trading journal. Document each trade, including entry and exit points, the rationale behind the trade, and the outcome. Regularly review your journal to identify patterns and recurring mistakes.
Analyze failed trades to understand what went wrong. Assess whether the mistake was due to a flaw in your strategy, poor risk management, or emotional decision-making. By pinpointing the root cause, you can make specific adjustments to improve your approach.
Seek feedback from trading communities or mentors. Discussing your trades with experienced traders can provide new insights and perspectives that you might have overlooked.
Continuously educate yourself. Stay updated with market trends, refine your technical analysis skills, and adapt your strategy based on the lessons learned from past mistakes.
Lastly, develop emotional discipline to avoid repeating the same errors. Practice stress management techniques and maintain a calm, focused mindset during trading. By systematically analyzing and addressing your mistakes, you can enhance your swing trading performance and achieve better long-term results.
What Strategies can help prevent common Swing Trading Errors?
To prevent common swing trading errors, it’s essential to adhere strictly to a well-defined trading plan. This plan should detail your entry and exit criteria, risk management rules, and profit targets, ensuring disciplined and consistent trading. Implementing robust risk management is crucial; always use stop-loss orders to limit potential losses and only risk a small percentage of your trading capital (1-2%) on each trade to safeguard your overall portfolio.
Avoiding overtrading is also key. Focus on high-quality trading opportunities that align with your strategy, and resist the temptation to trade too frequently. Adapting to market conditions is important as well; regularly review and adjust your strategy to stay effective in varying market environments, whether they are trending or range-bound.
Continuous improvement of your technical analysis skills is vital. Enhance your understanding and application of technical indicators, chart patterns, and support and resistance levels through ongoing education and practice. Maintaining emotional control is another critical strategy. Develop techniques to manage emotions like fear and greed, maintain a calm and focused mindset, and avoid making impulsive decisions driven by emotions.
Finally, keeping a detailed trading journal is indispensable. Document every trade, including your rationale and outcomes, and regularly review this journal to identify and learn from mistakes. By refining your strategy based on these insights, you can minimize errors and improve your trading performance, leading to more consistent success.
What are some successful Swing Trading Examples?
Successful swing trading examples often involve identifying key market trends and making well-timed trades based on technical analysis. Here are a few notable examples:
Example 1: Apple Inc. (AAPL) Trend Following A swing trader identifies an uptrend in Apple Inc. (AAPL) stock by observing a series of higher highs and higher lows on the daily chart. Using the 50-day Simple Moving Average (SMA) as a trend indicator, the trader buys shares when the price pulls back to the 50-day SMA, confirming the continuation of the uptrend. The trader sets a stop-loss just below the recent low to manage risk and targets a profit at the next resistance level. As the stock price moves up, the trader sells at the target, capturing a significant price swing within a few weeks.
Example 2: Tesla (TSLA) Breakout Trade Tesla (TSLA) has been trading within a consolidation pattern for several weeks, forming a clear resistance level at $700. The swing trader monitors the stock closely and notices a surge in trading volume as the price approaches the resistance. Anticipating a breakout, the trader buys shares as TSLA breaks above $700 with strong volume. A stop-loss is placed just below the breakout level to protect against a false breakout. The stock rapidly climbs to $750 over the next few days, where the trader exits the position, realizing a profitable swing trade.
Example 3: Amazon (AMZN) Reversal A swing trader spots a potential reversal pattern in Amazon (AMZN) stock after a prolonged downtrend. Using the Relative Strength Index (RSI), the trader notices that AMZN is in oversold territory with an RSI reading below 30. Additionally, a bullish hammer candlestick forms at a key support level, indicating a potential reversal. The trader buys shares as the price confirms the reversal by closing above the hammer’s high. A stop-loss is set below the recent low, and the target is set near the next resistance level. Over the next two weeks, AMZN rallies, allowing the trader to exit with a substantial gain.
Example 4: Microsoft (MSFT) Channel Trade Microsoft (MSFT) is trading within a well-defined price channel, with clear support at $280 and resistance at $300. The swing trader buys shares when the price approaches the lower boundary of the channel ($280) and shows signs of bouncing back up. The stop-loss is placed just below the support level to limit potential losses. As MSFT climbs towards the upper boundary of the channel ($300), the trader sells the position, effectively capturing the price swing within the channel.
How do Real-life Swing Traders Implement their Strategies?
Real-life swing traders implement their strategies by meticulously analyzing market trends, utilizing technical indicators, and maintaining strict risk management. They begin by identifying potential trade opportunities using tools like moving averages, Relative Strength Index (RSI), and support and resistance levels. Traders then set precise entry and exit points, ensuring trades align with their overall strategy, whether it’s trend following, breakout trading, or reversal patterns. Effective risk management is crucial, with traders placing stop-loss orders to limit potential losses and determining position sizes based on their risk tolerance. By maintaining a disciplined approach, documenting each trade in a trading journal, and continuously educating themselves, real-life swing traders can adapt to market conditions and refine their strategies to achieve consistent success.
What can we learn from Swing Trading Case Studies?
Swing trading case studies offer valuable insights into the practical application of trading strategies, risk management, and market analysis. They demonstrate how successful traders identify and capitalize on market trends and price movements. From these case studies, we learn the importance of meticulous technical analysis, such as using moving averages, RSI, and candlestick patterns to pinpoint entry and exit points.
They highlight the critical role of risk management, emphasizing the necessity of setting stop-loss orders and proper position sizing to protect trading capital. Additionally, case studies underscore the value of maintaining a trading journal for continuous improvement and learning. By studying real-life examples, traders can understand the effectiveness of different strategies, the impact of disciplined execution, and the need for ongoing education and adaptation to changing market conditions.