
In forex trading, resistance levels are roadblocks for price increases. Imagine an uptrend hitting a wall – that’s resistance. It’s a zone where historical price advances have been repeatedly halted, often due to increased selling pressure. Identifying these resistance levels is crucial, as they signal potential opportunities to exit long positions (selling previously bought currency) or even initiate short positions (borrowing and selling a currency expecting its price to fall) based on the anticipated reversal.
Identifying these resistance levels is crucial, as they signal potential opportunities to:
- Exit long positions: If you’ve been buying a currency expecting its price to rise (going long), a resistance level can be a good place to take profits and sell your position before a potential price reversal.
- Initiate short positions: If you believe the price will fall after reaching resistance, you can initiate a short position. This involves borrowing and selling a currency in anticipation of its price decline, allowing you to potentially profit from the downward movement.
However, it’s important to remember that resistance levels are not impenetrable walls. Price breakouts, where the price surges past resistance, can and do occur. This is why confirmation through technical indicators like moving averages or relative strength index (RSI) is valuable. These indicators can help assess the strength of the resistance zone and the likelihood of a reversal.
Table of Contents
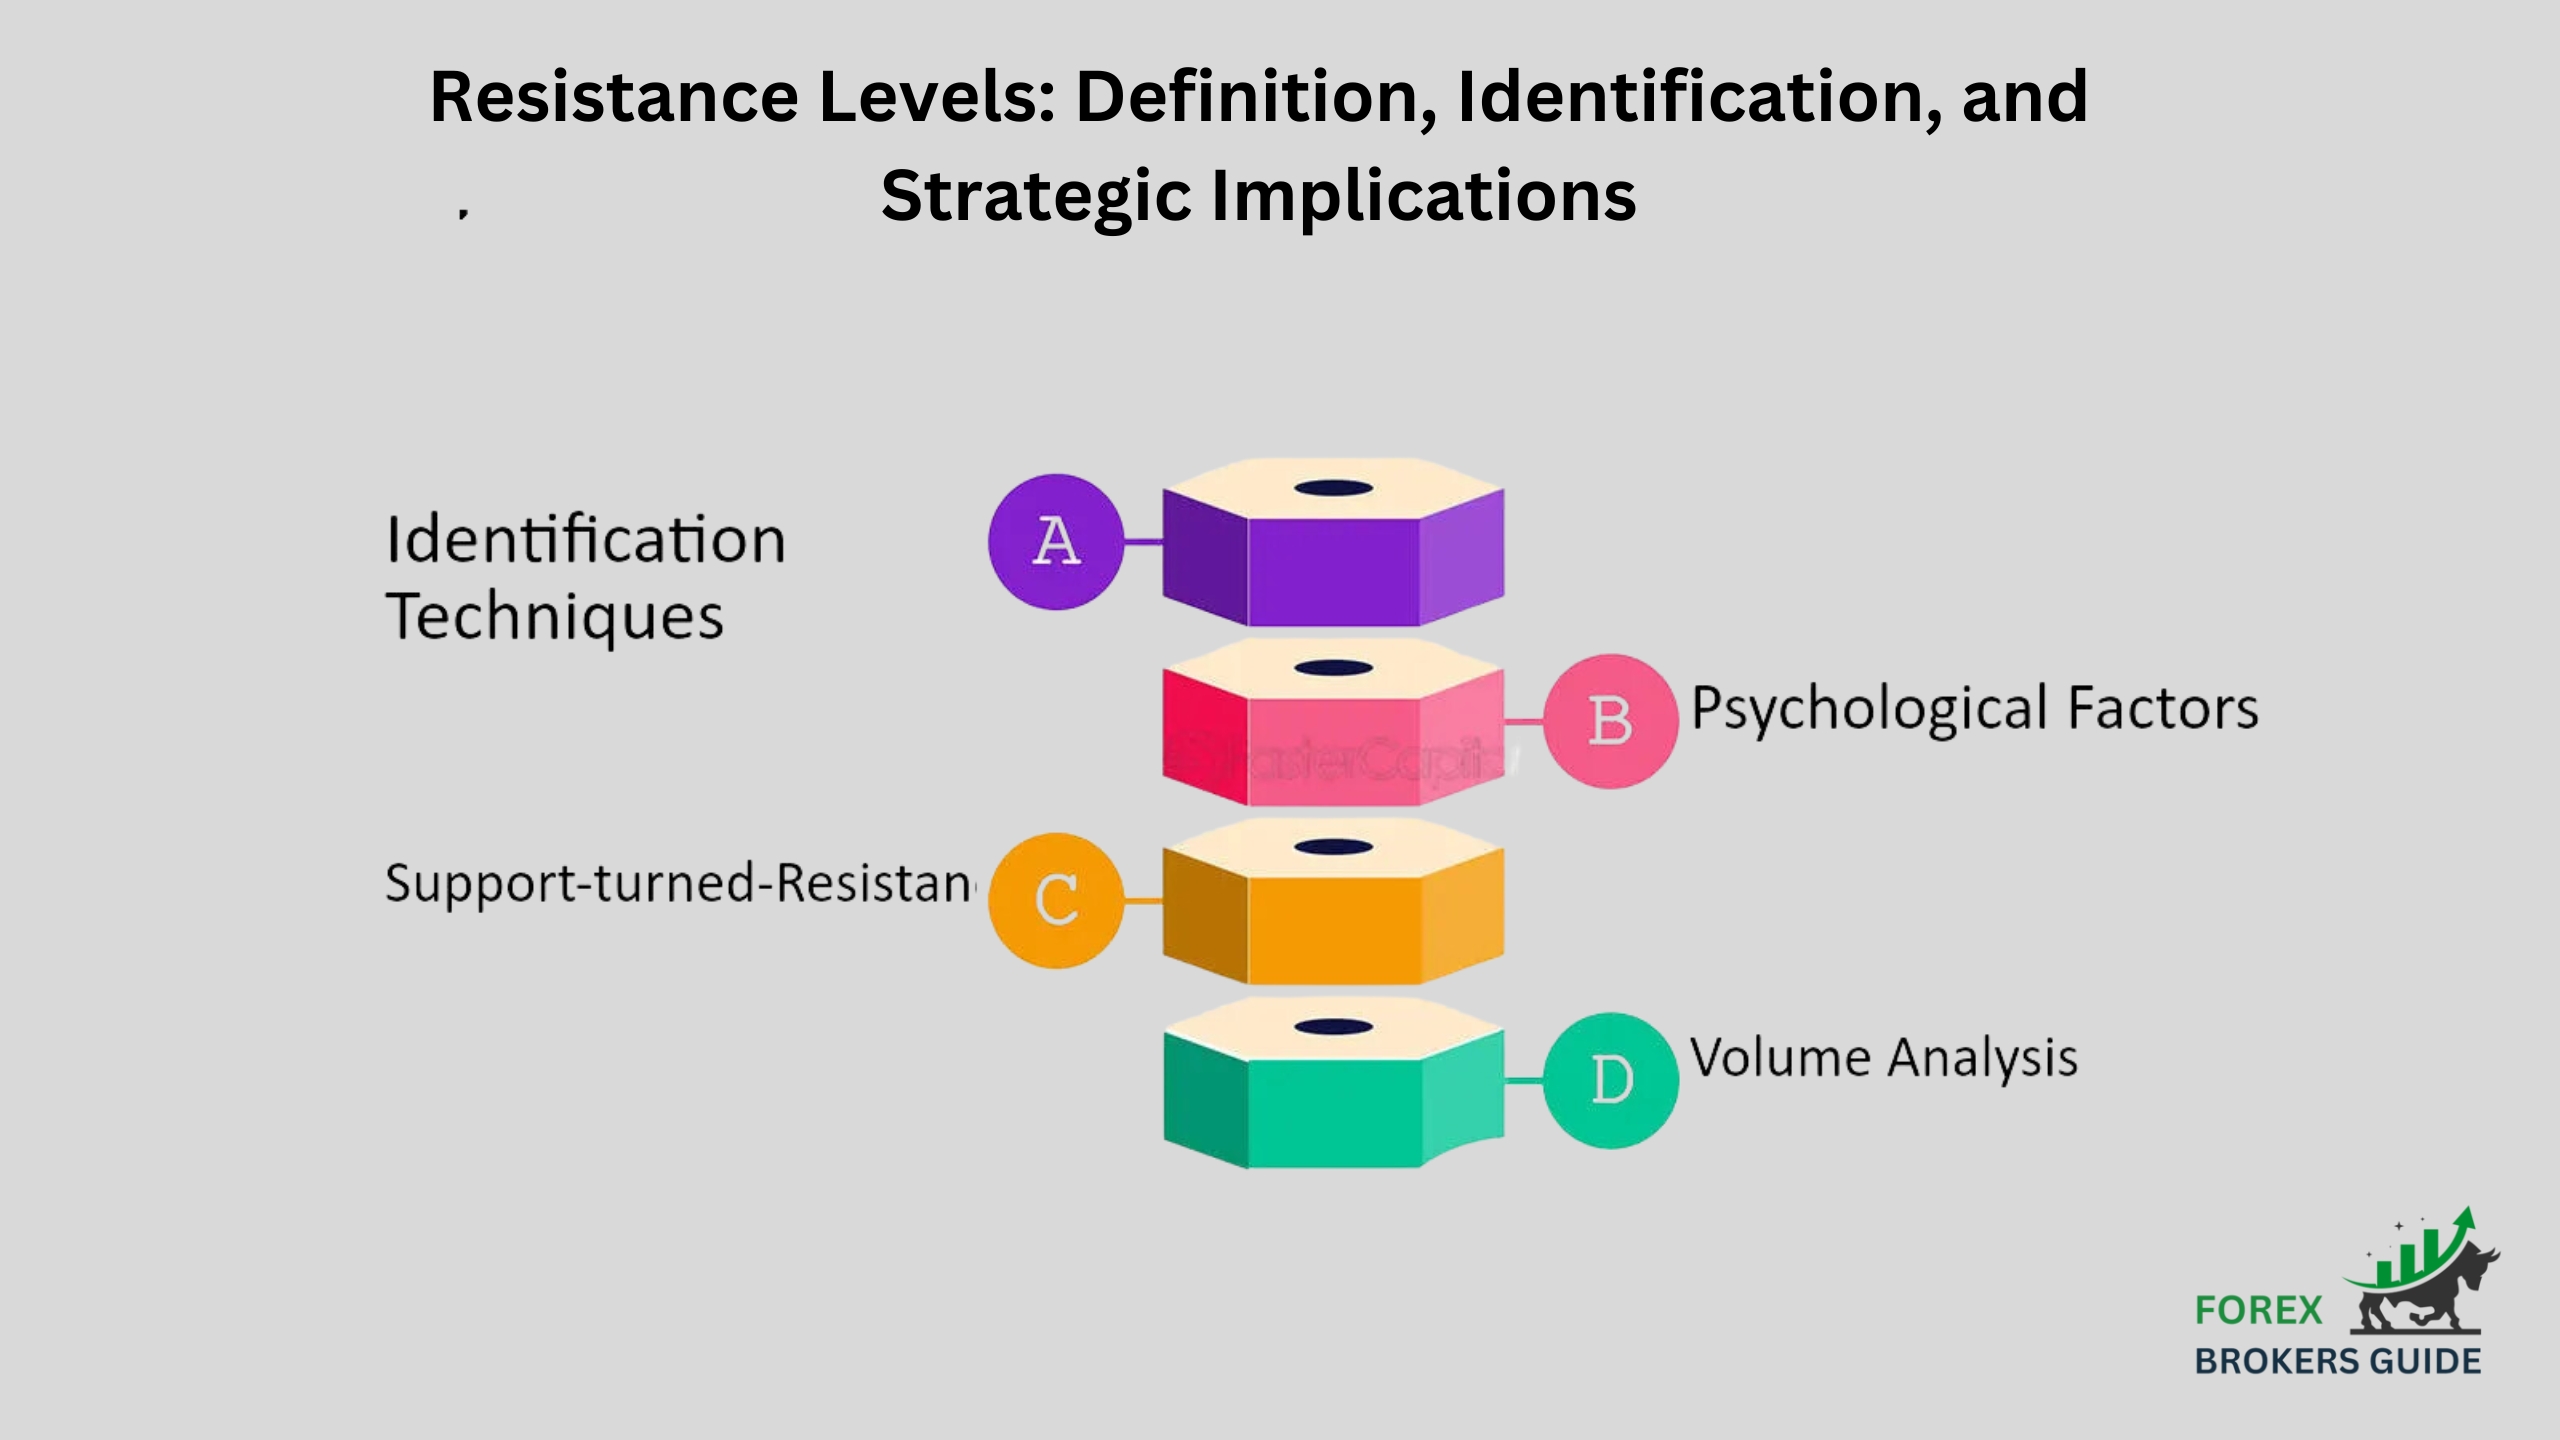
What are Resistance Levels in Forex Trading, and Why are they Significant?
Resistance levels in forex trading are zones where price increases tend to stall and potentially reverse. Imagine an uptrend hitting a ceiling – that’s resistance. It often arises from increased selling pressure as traders who bought earlier look to take profits or others anticipate a reversal. Identifying resistance is crucial because it signals potential opportunities to:
- Exit long positions: Sell currency you previously bought (going long) and lock in profits before a potential downturn.
- Enter short positions: Borrow and sell a currency expecting its price to fall after hitting resistance, allowing you to profit from the decline.
However, resistance levels aren’t foolproof. Price breakouts can happen. So, confirmation from technical indicators like moving averages strengthens the signal. By understanding resistance, forex traders can make informed entry and exit decisions, potentially capitalizing on price reversals or short-term pullbacks within an uptrend.
How does price behavior near Resistance Levels signal potential selling opportunities?
In forex trading, price behavior near resistance levels can be a treasure trove of clues for potential selling opportunities. As the price nears resistance, a shift in sentiment often occurs. Traders who bought earlier (going long) might be looking to take profits, anticipating a potential reversal. This increased selling pressure can push the price back down. Furthermore, failed breakouts, where the price attempts to surge past resistance but gets pushed back, can be a strong signal.
This failed attempt suggests strong selling pressure concentrated at that level, potentially indicating a downtrend and a good time to sell. To strengthen this analysis, forex traders can look for confirmation from technical indicators like moving averages or RSI reaching overbought zones near resistance. These indicators can provide additional evidence that a price reversal or pullback might be imminent. By carefully observing price action near resistance and incorporating confirmation from indicators, forex traders can gain valuable insights into potential selling opportunities before the price movement unfolds.
What Factors can Influence the Formation of Resistance Levels in the Forex Market?
In the forex market, resistance levels aren’t formed in a vacuum. Here’s a breakdown of the key influences:
Psychology Plays a Role:
- Profit-Taking Frenzy: As a currency surges, traders who bought earlier (going long) see an opportunity to lock in profits by selling near previous highs. This collective selling pressure creates resistance zones.
- FOMO Fear: New traders eager to ride the uptrend might jump in near prior highs. But if the price fails to break through, these new buyers might turn into sellers too, adding to the downward pressure and solidifying the resistance level.
Technicals Shape the Landscape:
- History Repeats Itself: Areas where price advances have repeatedly stalled leave behind historical highs. These act as potential resistance zones in the future as traders anticipate similar selling pressure at those levels.
- Moving Averages as Hurdles: Long-term moving averages can also act as resistance, especially during uptrends. If the price approaches a key moving average, like the 200-day, it might face selling pressure from traders anticipating a potential slowdown or reversal in the uptrend.
Which Technical Indicators can help identify Resistance Levels on Forex Charts?
Resistance levels, those areas where price increases tend to stall, can be a valuable tool for forex traders. However, a deceptive maneuver known as a false break can sometimes cloud the picture. Imagine the price surging towards resistance, seemingly poised to break through. Suddenly, instead of continuing higher, it reverses sharply and falls back below resistance. This is a false break.
So, what causes these false breaks? Often, it’s a combination of factors. Short-term buying pressure might push the price towards resistance, fueled by traders hoping for a breakout. However, as the price nears resistance, profit-taking from earlier buyers and increased selling pressure from those anticipating a reversal can overwhelm the buying pressure, leading to the false break and a price decline.
While false breaks can be frustrating, they shouldn’t be entirely discounted. Sometimes, they can act as a precursor to a future breakout. However, it’s crucial for forex traders to distinguish between genuine breakouts and false breaks. Confirmation from other technical indicators like strong bullish candlestick patterns and increased volume after the break can help identify a true breakout opportunity. By understanding false breaks and incorporating additional confirmation signals, forex traders can navigate the complexities of resistance levels with greater confidence.
How can past Price Action inform Potential Resistance Zones?
Past price action acts like a crystal ball for spotting potential resistance zones in forex trading. Here’s how:
- Scars of the Past: Areas on charts where price advancements have been repeatedly halted leave behind noticeable highs. These “battlegrounds” become potential resistance zones in the future. Traders anticipate similar selling pressure to emerge at those levels again as the price approaches them, potentially leading to a reversal.
- Technical Confirmation: While past highs offer a good starting point, technical indicators like moving averages can solidify a resistance zone’s significance. If a historical high coincides with a key moving average, like the 200-day moving average, the resistance zone becomes even stronger.
By analyzing past price action and incorporating technical confirmations, forex traders can gain valuable insights into where resistance levels might form. This knowledge empowers them to make informed decisions about entry and exit points, potentially capitalizing on price reversals or short-term pullbacks before the uptrend resumes.
How can Forex Traders confirm the Strength and Validity of Identified Resistance Levels?
Identifying resistance levels is just the first step for forex traders. To truly gauge their strength and validity, additional confirmation is crucial. Technical indicators like moving averages offer valuable insights. If a resistance level coincides with a key moving average, like the 200-day, it suggests a stronger zone with more significant selling pressure. Scrutinizing price action near resistance is also key. A clear rejection marked by a bearish candlestick pattern like a bearish engulfing bar indicates a stronger zone compared to a hesitant pullback. Finally, volume confirmation plays a role.
Higher volume on a failed breakout attempt near resistance suggests stronger selling pressure and a more likely reversal. Conversely, low volume might indicate a weaker resistance zone or a potential false break. By combining these confirmation techniques – technical indicators, price action analysis, and volume – forex traders can gain a more comprehensive understanding of the resistance zone’s strength and validity, leading to more informed decisions about potential reversals or shorting opportunities. Remember, a confluence of signals strengthens the analysis, as no single indicator is a guaranteed predictor in the ever-changing forex market.
How to use Resistance Levels for entering Short Positions and Managing Risk with Stop-loss Orders?
Resistance levels can be your allies when entering short positions (borrowing and selling a currency expecting its price to fall) and managing risk in forex trading. Here’s how:
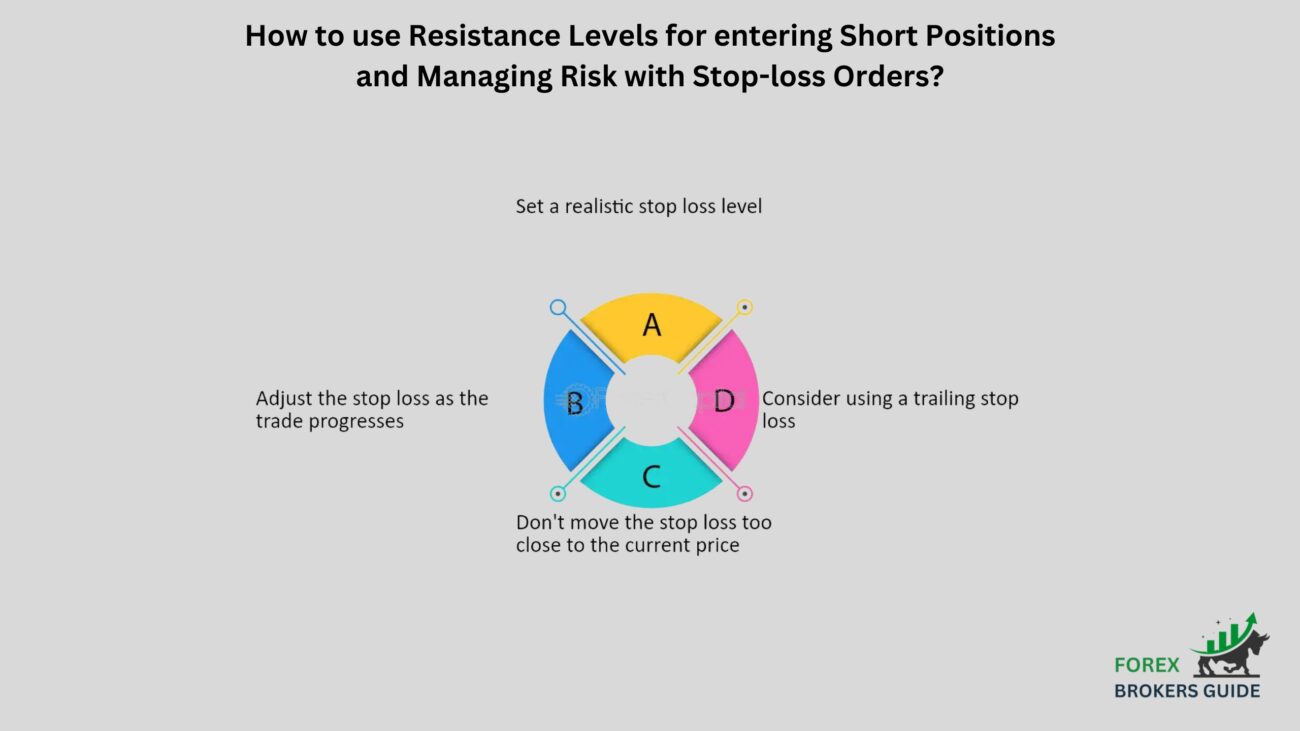
- Shorting at Resistance: When a currency’s price approaches a well-defined resistance level, and the level is confirmed as strong through technical indicators like a downtrending moving average or high volume failed breakouts, it can be a good opportunity to enter a short position. The reasoning is that the historical selling pressure at that level might resurface, pushing the price back down.
- Stop-Loss Placement: Once you’ve entered your short position, a stop-loss order acts as a safety net. Place it above the resistance level to limit potential losses if the price unexpectedly breaks through resistance. The wider the stop-loss, the lower your risk, but it also limits potential profits. Conversely, a tighter stop-loss minimizes risk but can get triggered by minor price fluctuations.
How can Forex Traders differentiate between true Breakouts above Resistance and False Signals?
Resistance levels, those roadblocks for price increases in forex trading, hold valuable information. But the real challenge lies in deciphering whether a price surge past resistance signifies a genuine breakout or a deceptive false signal. Here’s how forex traders can navigate this critical distinction.
The first line of defense lies in scrutinizing price action near resistance. A clear and forceful rejection marked by a bearish candlestick pattern like a bearish engulfing bar suggests a stronger resistance zone and a higher likelihood of a failed breakout. Conversely, a hesitant pullback or a series of smaller rejections might indicate a weaker resistance zone with a higher chance of a true breakout. Volume also plays a crucial role in confirmation. Higher trading volume on a failed breakout attempt near resistance strengthens the case for a false breakout and a potential reversal. Conversely, low volume on a rejection might indicate a weaker resistance zone or a lack of conviction from sellers, suggesting a possible true breakout.
Technical indicators can offer additional insights. The location of key moving averages is particularly informative. If the price decisively breaks above a resistance level that coincides with a downtrending moving average, like the 200-day moving average, it suggests a stronger breakout and a potential continuation of the uptrend.
Conversely, a breakout above resistance with a flat or slightly uptrending moving average might be less convincing and require further confirmation. Momentum indicators like the Relative Strength Index (RSI) can also be helpful. If the RSI is already in overbought territory (above 70) when the price approaches resistance, it suggests a potential for a breakout to lose steam and turn into a false signal. Conversely, a breakout above resistance with the RSI still in neutral territory indicates room for further upside potential.
The final piece of the puzzle is confirmation through follow-through price movement. A true breakout is often followed by the price sustaining the move above resistance. This suggests a shift in market sentiment with strong buying pressure overcoming selling pressure. Conversely, a false breakout might see the price quickly fall back below resistance after a brief surge, indicating a lack of conviction from buyers.
How can Forex Traders maintain discipline when Trading based on Resistance Levels?
Resistance levels, those areas where price increases tend to stall and potentially reverse in forex trading, offer valuable insights. But to truly harness their power, forex traders require a crucial ingredient: discipline. The fast-paced world of forex can be rife with emotional triggers and the allure of quick profits. Without discipline, these factors can easily cloud judgment and lead to impulsive decisions that stray from a well-crafted trading plan.
The key to success lies in meticulous planning and unwavering adherence to that plan. Develop a comprehensive trading strategy that outlines your entry and exit points based on resistance levels. This strategy should incorporate confirmation signals from technical indicators like moving averages and RSI, along with volume analysis. Once you’ve established your plan, treat it as sacrosanct. Even if the market seems to be moving against you initially, sticking to your plan is paramount. Remember, discipline is about following your strategy, not chasing every potential trade that emerges.
Fear of missing out (FOMO) can be a major enemy of discipline. If the price surges towards resistance and you haven’t entered a short position yet, resist the urge to jump in at the last minute. A trade without proper confirmation signals becomes a gamble, not a calculated decision based on your strategy. Breathe, remind yourself of your plan, and wait for the right opportunity with the right confirmation.
The fast-paced nature of forex trading can trigger emotional responses like greed and fear. To combat this, develop strategies to manage your emotions. Practice detachment from the outcome of individual trades and focus on the long-term success of your trading plan. Remember, a single loss based on a lapse in discipline can erase multiple profitable trades.
Everyone makes mistakes, and forex trading is no exception. If you find yourself breaking your trading discipline, analyze what went wrong. Was it FOMO leading you astray? Did you ignore confirmation signals in the heat of the moment? Use these experiences as valuable learning opportunities. Analyze your mistakes, strengthen your discipline, and refine your trading plan for the future.
How can Specific Price Action Patterns near Resistance Strengthen Trade Signals?
Specific price action patterns near resistance can strengthen trade signals in forex by offering visual confirmation of potential reversals or breakouts. For instance, a bearish engulfing bar near resistance suggests strong selling pressure, potentially amplifying the likelihood of a reversal and a shorting opportunity. Conversely, a bullish breakout with high volume following a pennant pattern near resistance increases confidence in the upside move and a potential long position. By recognizing these patterns and their context near resistance levels, forex traders can make more informed entry and exit decisions.
Analyzing resistance levels across different timeframes for a broader perspective?
Resistance levels, those areas where price increases tend to halt in forex trading, hold valuable clues. But to unlock their full potential, forex traders can benefit from a multi-timeframe analysis approach. Imagine zooming in and out on a map; this technique grants a broader perspective on potential price movements.
This multi-faceted approach offers valuable insights. Firstly, it strengthens the confirmation of resistance zones. If resistance on a shorter timeframe, like the 1-hour chart, coincides with resistance on a longer timeframe, like the daily chart, it paints a clearer picture. This confluence suggests a historically significant barrier that the price might struggle to overcome, increasing your confidence in a potential reversal.
On the other hand, the analysis can also expose breakout potential. If the price approaches resistance on a shorter timeframe but is trading well below resistance on a longer timeframe, it suggests a higher chance of a breakout. This scenario implies the shorter-term resistance might be less significant in the grand uptrend, potentially offering a long entry opportunity.
Finally, analyzing resistance levels across timeframes allows forex traders to gain a better understanding of the overall market context. By incorporating this broader view, traders can see if the resistance level aligns with major events or economic data releases. These factors can significantly influence the price movement and inform entry or exit decisions.
How to effectively combine Resistance Levels with other Technical Indicators for Forex Trading?
Resistance levels, those roadblocks where price advances tend to stall in forex trading, offer valuable clues about potential price reversals. However, their effectiveness can be significantly amplified by strategically combining them with other technical indicators. Here’s how forex traders can create a more robust trading strategy:
Confirmation and Divergence:
- Moving Averages: The location of key moving averages in relation to resistance levels provides valuable confirmation. A price decisively breaking above resistance that coincides with a downtrending moving average, like the 200-day moving average, suggests a stronger breakout and a potential continuation of the uptrend. Conversely, a price struggling near resistance with a flat or slightly uptrending moving average might indicate a weaker resistance zone and require further confirmation.
- Momentum Indicators: Momentum indicators like the Relative Strength Index (RSI) can offer additional insights. If the RSI is already in overbought territory (above 70) when the price approaches resistance, it suggests a potential for a breakout to lose steam and turn into a failed signal. Conversely, a breakout above resistance with the RSI still in neutral territory indicates room for further upside potential.
Identifying Underlying Trends:
- Trend Following Indicators: Combining resistance levels with trend-following indicators like MACD (Moving Average Convergence Divergence) can provide a clearer picture of the underlying trend. If the MACD is generating buy signals while the price approaches resistance, it strengthens the case for a potential breakout and continuation of the uptrend. Conversely, a sell signal from the MACD near resistance might reinforce the possibility of a reversal.
Gauging Market Sentiment:
- Volume Analysis: Volume plays a crucial role in confirming the significance of price movements near resistance levels. Higher trading volume on a failed breakout attempt near resistance strengthens the case for a false breakout and a potential reversal. Conversely, low volume on a rejection might indicate a weaker resistance zone or a lack of conviction from sellers, suggesting a possible true breakout.
By incorporating this strategic combination of resistance levels with technical indicators, forex traders can:
- Strengthen Confirmation: Indicators like moving averages and RSI can provide valuable confirmation of the strength or weakness of a resistance zone, leading to more informed entry and exit decisions.
- Identify Underlying Trends: Combining resistance levels with trend-following indicators can offer a clearer picture of the prevailing trend, allowing traders to capitalize on breakout opportunities within the trend’s direction.
- Gauge Market Sentiment: Volume analysis, when combined with resistance levels, can shed light on the underlying market sentiment. High volume suggests stronger conviction behind the price movement, while low volume might indicate uncertainty.
What are the Limitations of Relying Solely on Resistance levels for trading decisions?
Resistance levels are forex traders’ allies, but not flawless fortune tellers. Sole reliance on them has limitations. Firstly, they can generate false breakouts or misleading rejections, particularly in volatile markets. Confirmation from price action and volume analysis is crucial to differentiate real breakouts from deceptive signals. Secondly, resistance levels indicate potential selling pressure, but not the price direction after a breakout.
Combining them with trend-following indicators clarifies whether a breakout signals a trend’s continuation or a short-term move. Finally, resistance levels exist in isolation without considering broader market forces. Upcoming news or economic data can significantly influence prices, potentially rendering resistance levels less relevant in the short term. By acknowledging these limitations and incorporating other technical indicators and fundamental analysis, forex traders can leverage the valuable insights of resistance levels while avoiding the pitfalls of relying solely on this one tool.
How do different Market Conditions (trending vs. ranging) impact Resistance Levels?
The impact of resistance levels in forex trading depends heavily on market conditions. In uptrends, resistance becomes a hurdle to overcome. A confirmed breakout with strong volume suggests the uptrend continues, offering long entry chances. Conversely, downtrends see resistance turn into potential support. A price bouncing back from resistance with strong buying pressure might signal a trend pause or reversal, presenting short-selling opportunities.
Ranging markets make things trickier. Resistance becomes less defined as the price tests both resistance and support repeatedly. Price action confirmation and indicators like Bollinger Bands become crucial for spotting breakouts or breakdowns from the range. Understanding how trends and ranging markets affect resistance empowers traders to adapt their strategies and make informed entry and exit decisions.
Where can Forex Traders find Resources to improve their Resistance Level Identification Skills?
Conquering resistance levels in forex trading empowers you to make informed entry and exit decisions. Here’s your roadmap to resources that can hone your skills:
Online forex education platforms like Investopedia Academy or FXCM Markets offer modules specifically dedicated to technical analysis and resistance levels, taught by qualified instructors. Dive deep into these resources to build a strong foundation.
Many forex brokers offer a wealth of educational materials for their clients. Webinars, video tutorials, and articles focused on technical analysis and resistance levels can be a valuable starting point, especially if you’re already using a particular broker. Leverage these resources to complement your online learning.
Supplement your online learning with forex trading books. “Technical Analysis of the Financial Markets” by John Murphy is a classic that offers in-depth explanations of resistance levels and their application in various market conditions. Consider this for a deeper understanding.
Engage with online forex trading forums and communities. These can be a treasure trove of knowledge. Engage with experienced traders, learn from their insights, and share your own experiences. Remember to approach advice with a critical eye and prioritize information from reputable sources.
Once you’ve begun learning, put your knowledge to the test in a risk-free environment. Most forex brokers offer demo accounts with virtual funds. This allows you to practice identifying resistance levels and implementing related trading strategies without risking real capital. Practice makes perfect, without risk.
Breakouts: Identifying, Confirming, and Trading Strategy Insights
27 May 2024[…] potential continuations of existing trends. They occur when the price decisively breaks above resistance levels in uptrends or below support levels in downtrends. By understanding how breakouts signal trend […]
Candlestick Charts: Interpretation, Patterns, and Application in Market Analysis
28 May 2024[…] also be susceptible to misleading formations. False breakouts, where the price pierces a support or resistance level but quickly reverses, can lure traders into unprofitable positions. Here’s how to identify and […]
Scalping: Definition, Techniques, and Key Strategies for Quick Trades
1 June 2024[…] and resistance zones, areas where the price has bounced off previously, are crucial. Scalpers can enter long […]
Swing Trading: Understanding the Approach, Strategies, and Benefits
3 June 2024[…] and Resistance Levels: Understanding support and resistance levels is fundamental to swing trading. Support levels indicate where a price tends to find a floor, while […]