
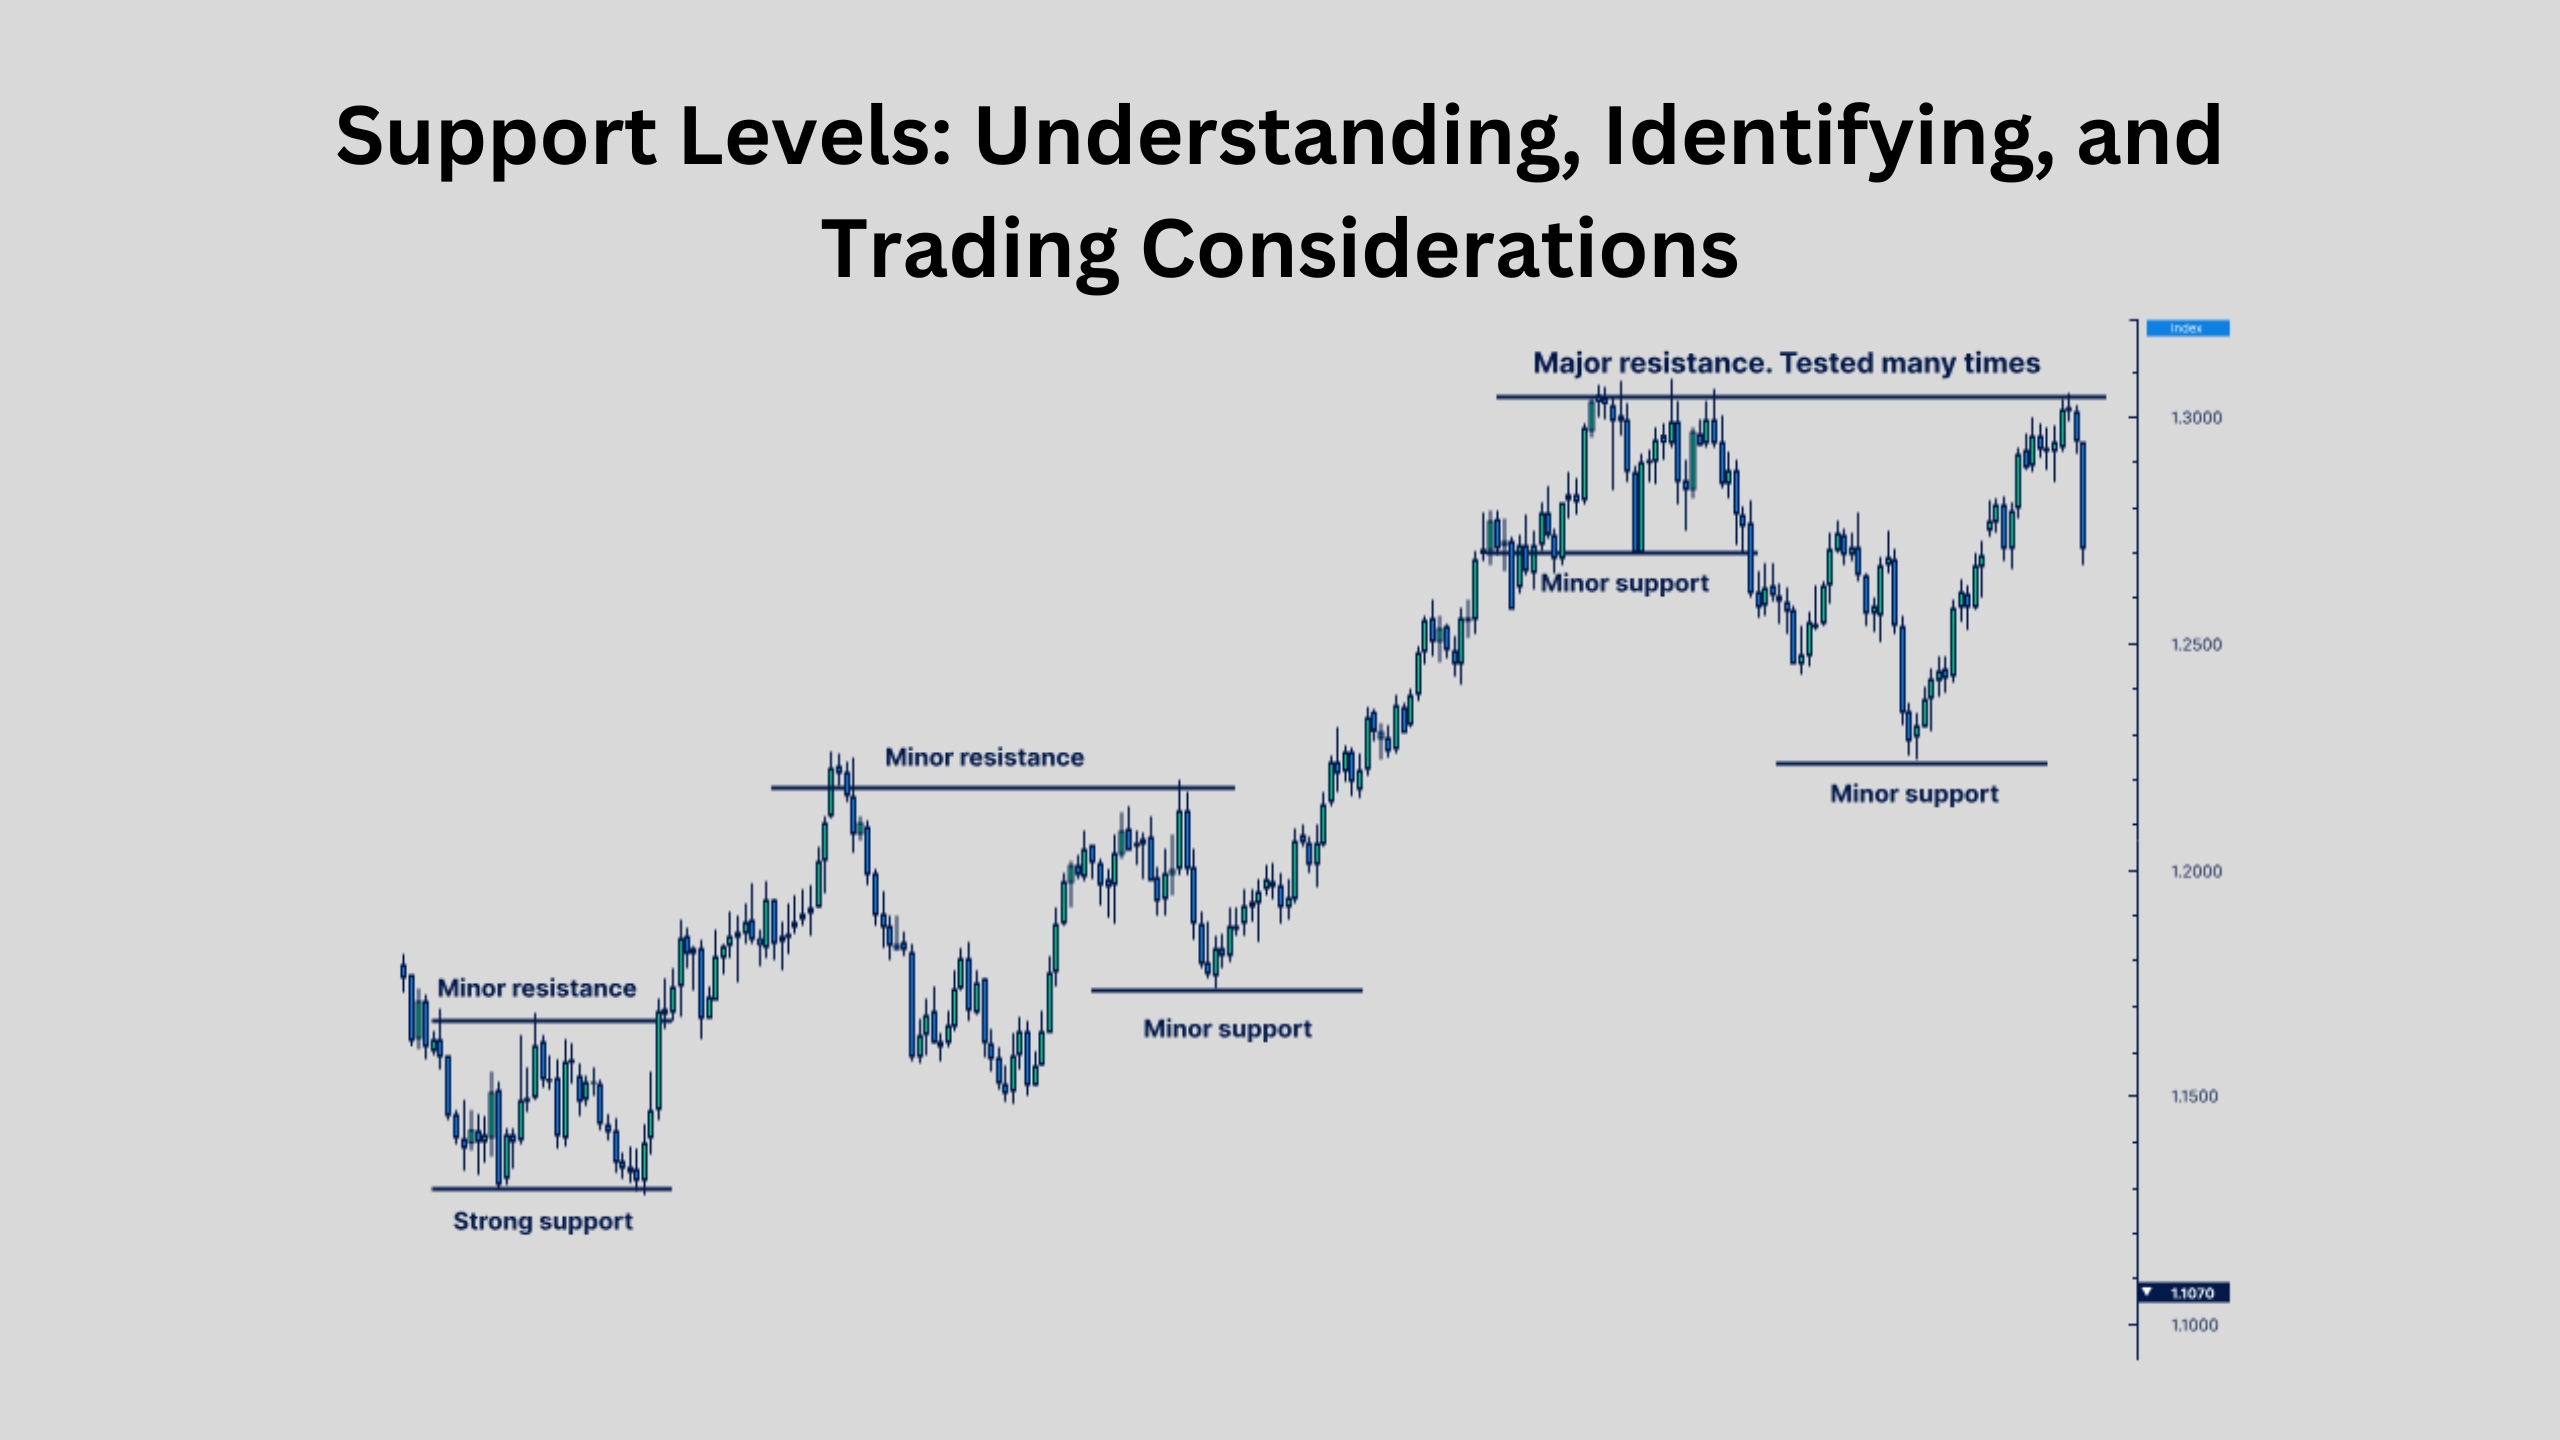
In the dynamic world of forex trading, support levels act as a crucial concept. Imagine a safety net for rising prices. A support level is a price zone on a forex chart where the price has historically encountered buying pressure, halting or slowing down a downtrend. This buying pressure can arise from various factors, such as technical indicators signaling oversold conditions, bargain hunters entering the market, or large orders placed by institutional investors. As the price approaches the support zone from below in an uptrend, it’s likely to meet renewed buying interest, potentially pushing the price back up and continuing the uptrend.
Understanding and identifying support levels empowers forex traders to make informed decisions. By strategically placing entry and exit points for trades, traders can potentially capitalize on the uptrend’s continuation or exit positions before a potential trend reversal. Support levels also serve as a psychological benchmark, influencing trader sentiment. If the price repeatedly bounces off a support level, it reinforces the perception of strong buying pressure at that zone, potentially attracting even more buyers and strengthening the support further. This interplay between price action, technical analysis, and trader psychology makes support levels a cornerstone concept in forex trading.
What are Support Levels in Forex Trading, and why are they Important?
A support level is a zone on the price chart where the price has historically encountered buying pressure. This buying pressure can halt or slow down a downtrend. Imagine it as an invisible wall that props prices up. Support levels arise due to various factors like technical indicators suggesting oversold conditions, bargain hunters entering the market, or large institutional buying. As the price approaches this zone from below in an uptrend, it’s likely to meet renewed buying interest, potentially pushing the price back up and continuing the uptrend.
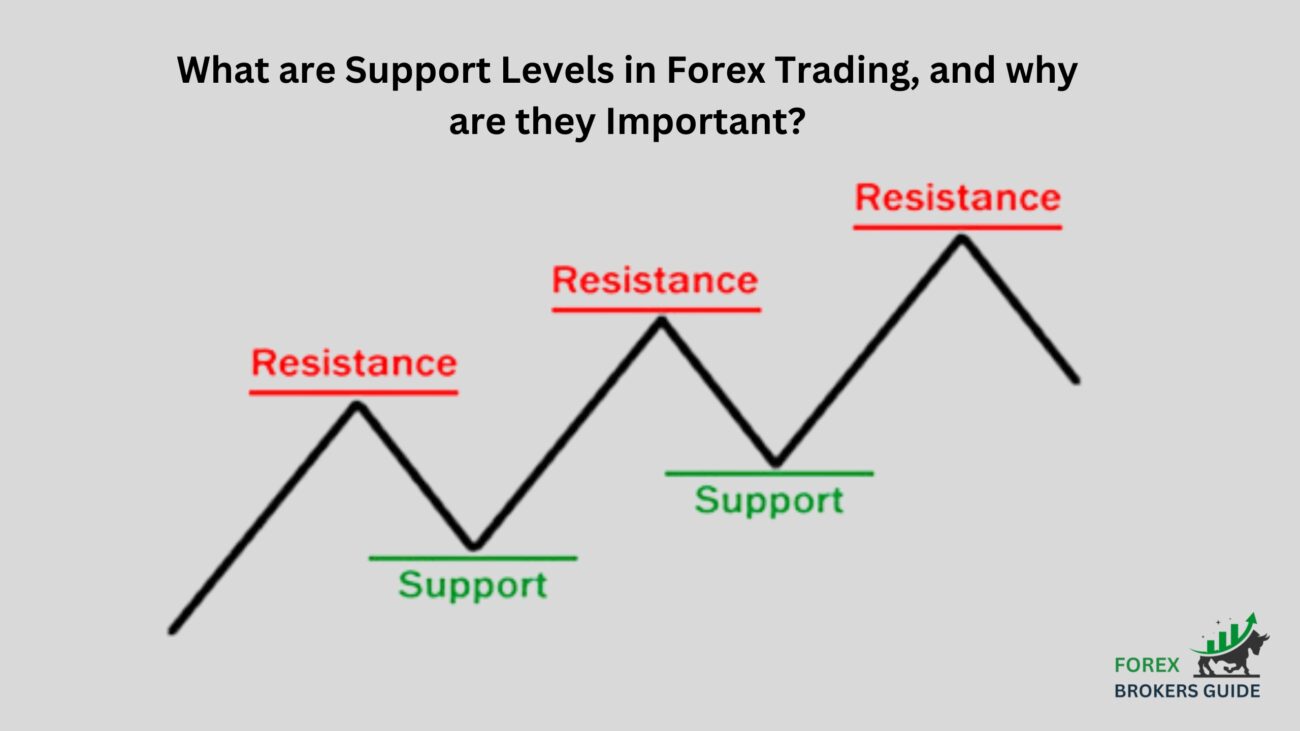
Understanding and identifying support levels empowers forex traders to make informed decisions. By strategically placing entry and exit points for trades, traders can potentially capitalize on the uptrend’s continuation or exit positions before a potential trend reversal. Support levels also serve as a psychological benchmark, influencing trader sentiment. If the price repeatedly bounces off a support level, it reinforces the perception of strong buying pressure at that zone, potentially attracting even more buyers and strengthening the support further. This interplay between price action, technical analysis, and trader psychology makes support levels a cornerstone concept in forex trading.
How does Price Action near Support Levels indicate Potential Buying Opportunities?
levels in forex trading are like hidden messages, and price action acts as the decoder. By carefully analyzing how price behaves near these zones, traders can gain valuable insights into potential buying opportunities and make informed entry decisions.
Imagine the price approaching a support level from below. If it then reverses course and starts moving upwards, it’s a potential sign of a buying opportunity. This price reversal suggests a shift in the balance of power between buyers and sellers. The significance of this signal increases if the price has bounced off this support zone multiple times in the past, indicating a historically strong buying presence at that level.
Certain candlestick patterns act as visual confirmations of potential buying opportunities near support. A bullish pin bar, with a long tail wick extending below the support level, suggests strong buying pressure at that price point. The long wick signifies rejected selling attempts, potentially leading to a reversal and uptrend continuation. Similarly, an engulfing bullish pattern, where a large bullish candle completely engulfs a smaller bearish candle near the support zone, visually confirms overwhelmed selling pressure and a potential surge in buying.
While price action offers valuable clues, it’s crucial to consider volume as well. Imagine the price bouncing off a support level, but with minimal trading volume. This suggests a weak bounce and a less convincing buying opportunity. Conversely, high trading volume accompanying a price bounce off a support level strengthens the signal. This surge in volume indicates increased buying activity and a higher likelihood of the uptrend continuing.
What factors can Influence the Formation of Support Levels?
Support levels in forex trading aren’t mere happenstances. Several invisible architects play a crucial role in shaping these zones where buying pressure tends to materialize.
One factor is the psychological allure of round numbers. Prices like 1.2000 or 1.3500 hold a certain weight for traders. These levels often attract a confluence of buy orders or stop-loss orders placed nearby. This concentration of buying pressure can act as a buffer, halting a downtrend and establishing support.
Technical indicators also contribute to identifying support zones. When an indicator like the Relative Strength Index (RSI) reaches oversold readings, it can signal a potential buying opportunity. Traders who interpret these indicators as oversold conditions might see this as an attractive entry point, creating fresh buying pressure that forms support.
The past can also be a key architect of support. If the price has a history of bouncing off a specific price zone, it strengthens that zone’s significance as a potential support level. This repetitive behavior suggests historical buying interest at that price point. Traders, anticipating similar buying behavior in the future, reinforce the support level as they position themselves to capitalize on a potential buying opportunity.
Finally, upcoming market events can subtly influence the formation of support. Scheduled economic data releases or central bank pronouncements can impact market sentiment. If the market anticipates positive news, it might create a general buying bias. This can lead to support formation at current price levels, as traders are more likely to buy even if the price dips slightly before the event.
Which Technical Indicators can help identify Support Levels in Forex Charts?
Support levels offer a sense of stability. But how do traders identify these crucial zones where buying pressure is likely to emerge? Technical indicators, while not foolproof, can offer valuable hints.
The Relative Strength Index (RSI) acts like a momentum gauge. When the RSI dips into oversold territory, it suggests the price might have fallen excessively. This can attract bargain hunters, perceiving the price as undervalued. This influx of buying pressure can potentially form a support level. Imagine the RSI as a contrarian indicator – a low RSI hinting at a potential reversal and support formation as the downtrend loses steam.
Moving averages play a role by smoothing out price fluctuations and revealing the underlying trend. If the price repeatedly finds support near a specific moving average, like the 50-period or 200-period, it can indicate a potential support zone. This repetitive behavior suggests the moving average acts as a line of demarcation, separating buying and selling pressure. Consistent support near a moving average signifies a historical buying presence at that price level.
But technical analysis extends beyond indicators. Price action itself holds valuable clues. By analyzing historical price movements on a chart, traders can identify horizontal lines where the price has repeatedly reversed course and bounced upwards. Imagine drawing horizontal lines at these reversal zones. The more frequent the price finds support around a particular horizontal line, the stronger the support is considered. These lines transform into potential support zones based on historical buying pressure at those price levels.
Fibonacci retracements offer another perspective. This tool, based on historical price movements and ratios, identifies potential retracement levels after a strong price move. These retracement levels can act as support zones, as some traders might anticipate a bounce at these predetermined Fibonacci levels. Fibonacci retracements add another layer of analysis, suggesting potential buying zones based on historical price patterns.
How can historical Price Movements inform potential Support Zones?
In the fast-paced world of forex trading, historical price movements offer a valuable window into the future. By analyzing past price action, traders can unearth potential support zones – areas where buying pressure is likely to emerge and halt a downtrend. Here’s how these historical insights act as a crystal ball for forex traders:
Imagine a price steadily declining on a forex chart. Suddenly, it encounters a specific level and reverses course, starting to move upwards. This reversal zone becomes a potential candidate for a support level. If this price reversal happens repeatedly at the same level over time, the significance of the zone as a support level strengthens. This repetitive behavior suggests historical buying interest at that price point. Traders, recognizing this pattern, might anticipate similar buying behavior in the future, potentially leading to the formation of a strong support level.
By analyzing historical price action on a chart, traders can identify horizontal lines where the price has repeatedly encountered resistance during a downtrend and bounced upwards. Imagine drawing horizontal lines across the chart at these reversal zones. The more times the price finds support around a particular horizontal line, the stronger the support is considered to be. These horizontal lines become potential support zones based on the historical buying pressure that emerged at those price levels in the past.
How can Forex Traders confirm the validity of identified Support Levels?
Confirming the validity of a support level before entering a trade is vital in forex. Here’s how traders can strengthen their conviction:
- Price Action: Look for bullish candlestick patterns or a clear price rejection at the support zone followed by an upward move, indicating buying pressure.
- Volume: High trading volume alongside a price bounce off support suggests increased buying activity and a stronger uptrend possibility.
- Test of Time: A support level tested and bounced off multiple times in the past holds more weight, as it reinforces historical buying presence at that price point.
- Technical Indicators: Consider if the support zone coincides with a key moving average or an oversold reading on the RSI, offering additional confirmation of buying pressure.
How to use Support Levels for Entry Points and Manage Risk with Stop-loss Orders?
Support levels in forex transform from guideposts to launchpads. Here’s how to use them for entries and manage risk:
Entry Points: Look for buying pressure near support through price action cues like bullish candlesticks or price rejection followed by an upward move. A history of price reversals at the support strengthens the entry. Consider technical indicators like oversold RSI or a price touching a key moving average at the support for additional confirmation.
Risk Management: Once you enter a long position (buying) near support, a stop-loss order is essential. This order automatically exits the trade if the price falls below a set level, limiting losses. Place the stop-loss below the support with a buffer zone to avoid premature exits from price swings. Consider market volatility when placing the stop-loss – a more volatile market might require a wider buffer. Always establish a risk-reward ratio comparing potential profit to potential risk. Ideally, the reward should significantly outweigh the risk.
How can Forex Traders differentiate between True Breakouts and False Breakouts of Support?
Distinguishing real breakouts from fleeting fakeouts of support levels in forex is a vital skill. Here’s how to navigate this challenge:
Confirmation is Key: True breakouts tend to announce their arrival with a bang – strong price action accompanied by a surge in trading volume. Look for a decisive break below the support zone, followed by sustained downward movement and increasing volume. Fakeouts, on the other hand, might exhibit a brief breach of the support but with minimal volume and a quick price snap back above the level.
The Retest Trap: After a breakout, a genuine trend shift might see the price revisit the support zone for a brief moment (retest) before continuing the downtrend. This retest can be a good entry point for short (sell) trades if confirmed by price action. Fakeouts typically lack this retest, sparing traders the risk of entering a sell position prematurely.
Timeframe Matters: Don’t get caught up in short-term noise. Analyze the breakout on multiple timeframes. A breakout confirmed on a higher timeframe, like the daily chart, holds more weight than a breakout only visible on a lower timeframe chart.
Market Context is King: Upcoming economic data releases or central bank pronouncements can influence breakouts. If the market anticipates positive news, a support level might break due to increased selling pressure in the short term. However, this doesn’t necessarily signal a long-term trend change. Consider the broader market context before interpreting a breakout.
How can Forex Traders maintain discipline when trading based on support levels?
Maintaining discipline when trading forex based on support levels is crucial for long-term success. This starts with a well-defined trading plan. Outline clear entry and exit criteria based on support levels, and treat this plan as your roadmap. Avoid impulsive detours fueled by emotions or short-term market noise. Discipline also means demanding confirmation. Don’t rush into a trade based solely on a potential breakout below support. Look for strong signals through price action and volume to ensure it’s a genuine breakout, not a fleeting fakeout. Risk management is another pillar of discipline. Always utilize stop-loss orders to limit potential losses if the price breaks through support unexpectedly. Remember, support zones indicate buying pressure, but they aren’t impenetrable walls. Finally, cultivate realistic expectations. Understand that support levels are areas of potential price reversals, not absolute guarantees. Focus on managing risk and capitalizing on profitable trades, not achieving an unrealistic win rate. By maintaining emotional detachment, you can avoid the pitfalls of chasing losses or revenge trading after a failed support-based trade. Staying calm and composed throughout the trading process is key to disciplined decision-making. By combining a well-defined plan, confirmation seeking, risk management, realistic expectations, and emotional control, forex traders can navigate the world of support levels with focus and potentially achieve consistent trading success.
How can specific Price Action Patterns near Support Strengthen Trade Signals?
Price action patterns near support levels in forex act like a magnifying glass for trade signals. Imagine the price dipping towards support. Instead of breaking through, it forms a bullish reversal pattern like a pin bar or an engulfing pattern. This price action strengthens the buying signal near support, suggesting a higher likelihood of a reversal and potential upward move. The signal gets even brighter with volume confirmation. High volume on a bullish reversal pattern near support indicates increased buying activity, further solidifying the potential for a trend reversal and an upside opportunity. Finally, failed breakouts can be powerful signals. If the price attempts to break below support but fails, and this is followed by a bullish reversal pattern, it suggests strong buying pressure at that level. By recognizing these specific price action patterns near support zones, forex traders can gain additional confidence in their trade signals, potentially leading to more informed entry decisions and improved trading results.
Analyzing Support Levels across different Timeframes for a Broader Perspective?
Support levels in forex are like guideposts, but a single timeframe only tells part of the story. Here’s why analyzing support levels across different timeframes is crucial:
Confirmation Strengthens Your Conviction: Imagine a support level respected on the daily chart and the hourly chart. This consistency across timeframes strengthens the signal. It suggests more significant buying pressure concentrated at that price point, increasing your confidence in a potential reversal or pause in a downtrend.
Context is King: Analyzing support levels across multiple timeframes helps you understand the bigger market picture. A support level on the daily chart might be a minor pause within a longer downtrend visible on the weekly chart. This contextual awareness prevents you from mistaking a short-term bounce for a complete trend reversal.
Timeframe-Specific Entry Opportunities: Multi-timeframe analysis opens doors for pinpointing entry points on different time horizons. A break below support on a higher timeframe might signal a downtrend. However, analyzing the same support level on a lower timeframe might reveal a short-term pullback opportunity before the downtrend resumes. This allows you to potentially capitalize on both short-term and long-term trends based on support levels.
How to effectively combine Support Levels with other Technical Indicators for Forex Trading?
Support levels are a forex trader’s roadmap, but for a more precise navigation system, combine them with other technical indicators. Look for confirmation from moving averages or oversold RSI readings to strengthen the support signal. Divergences on MACD or Stochastic Oscillator, where the indicator rises despite price weakness near support, can hint at a potential reversal. Bollinger Bands and ATR offer insights into volatility and trend direction. A support level near the lower Bollinger Band suggests strong buying pressure, while a level near the upper band or in a high ATR environment might be weaker. By weaving support levels with these indicators, forex traders can gain a richer understanding of market sentiment and make more informed entry and exit decisions. Remember, no single indicator is a guaranteed predictor, but this confluence of signals empowers traders to navigate the forex market with greater confidence.
What are the Limitations of relying Solely on Support Levels for Trading Decisions?
Support levels are like guideposts in forex trading, but they’re not foolproof. Here’s why relying solely on them can be risky:
- False Breakouts Lurk: Prices can sometimes pierce through support levels, leading to losses if you entered a trade based solely on the support. To avoid this trap, look for confirmation through strong price action and increased trading volume before entering a trade.
- Directionless Signals: Support levels indicate buying pressure, which is great, but they don’t necessarily tell you if the price will truly reverse course. The price might just pause at the support level before continuing its downtrend. To gain a clearer picture of the direction, consider combining support levels with trend indicators like moving averages.
- Shifting Landscapes: Support levels aren’t etched in stone. Market dynamics can cause them to move over time. To assess if a support level is still relevant, analyze it across different timeframes and consider using indicators like Bollinger Bands, which can help gauge market volatility and the potential strength of the support zone.
- Missing the Bigger Picture: Support levels only tell part of the story. They don’t take into account important factors like upcoming economic data releases or central bank pronouncements, which can significantly influence price movements. A seemingly strong support level might break due to unexpected news, leading to losses.
How do Different Market Conditions (trending vs. ranging) Impact Support Levels?
Support levels, a forex trader’s guideposts, aren’t one-size-fits-all. Market conditions play a big role in how they behave. In trending markets (up or down), support levels are clearer and more respected by the price. Confirmed breaks below support in downtrends or above resistance in uptrends can even signal a continuation of the trend, offering potential trading opportunities. As the trend progresses, support levels themselves can shift up in uptrends or down in downtrends. Ranging markets, however, turn support levels into fuzzy zones, not sharp lines. The price might test this zone repeatedly before bouncing back. False breakouts are also more frequent due to the lack of a clear trend direction. Here, traders should focus on price action near support. Look for strong bullish reversal patterns and increased volume to confirm potential buying opportunities. By understanding how market conditions influence support levels, forex traders can make better entry and exit decisions, navigating the ever-changing forex market with more confidence.
Where can forex traders find resources to improve their support level identification skills?
Level up your support level identification skills in forex trading! Here’s your learning toolkit:
- Free Online Resources: Many forex brokers and financial websites offer free educational sections on technical analysis, including guides on support levels and how to spot them on charts.
- Structured Courses: Consider online courses or webinars specifically focused on support and resistance trading. These provide a structured learning path with insights from experienced traders.
- Timeless Texts: Classic technical analysis books often cover support and resistance levels. These offer a foundation in these key concepts.
- Online Forex Communities: Don’t underestimate the value of online forex trading forums and communities. Participate in discussions, ask questions, and learn from the practical experiences of other traders when it comes to identifying support levels.
Resistance Levels: Definition, Identification, and Strategic Implications
25 May 2024[…] continues, offering long entry chances. Conversely, downtrends see resistance turn into potential support. A price bouncing back from resistance with strong buying pressure might signal a trend pause or […]
Scalping: Definition, Techniques, and Key Strategies for Quick Trades
1 June 2024[…] Support and resistance zones, areas where the price has bounced off previously, are crucial. Scalpers can enter long positions near support, anticipating a price bounce, or exit near resistance, expecting a reversal. Breakouts, when the price decisively breaks through support or resistance, can also signal trends. Scalpers can enter long positions on breakouts above resistance to capture the initial surge or enter short positions on breakouts below support to profit from the price decline. […]
Swing Trading: Understanding the Approach, Strategies, and Benefits
3 June 2024[…] and Resistance Levels: Support levels are price points where an asset tends to stop falling and start rising, while resistance levels are […]