
Trendlines emerge as a simple yet powerful tool for traders. A trendline is a straight line drawn on a price chart that connects a series of highs (for uptrends) or lows (for downtrends). By visually connecting these price points, the trendline depicts the overall directional bias of the market. Imagine a line drawn along the bottom of rising prices in an uptrend. This line acts as a support level, suggesting potential buying pressure if the price approaches it. Conversely, in a downtrend, a line drawn along the tops of falling prices acts as a resistance level, indicating potential selling pressure if the price reaches that point.
The importance of trendlines lies in their ability to simplify complex price movements and offer valuable insights. By identifying valid trendlines, traders can gauge the strength and direction of a trend, anticipate potential price reversals near support or resistance zones, and make informed entry and exit decisions for their trades. Furthermore, trendlines can be used in conjunction with other technical indicators to strengthen trading signals and refine overall trading strategies.
What are Trendlines in Forex Trading?
A trendline in forex trading is a straight line drawn on a price chart that connects a series of swing highs (in an uptrend) or swing lows (in a downtrend). This line depicts the overall directional bias of the market, helping traders gauge the trend’s strength and potential future price movements. This line acts as a visual representation of the prevailing market sentiment, helping traders gauge the trend’s strength and anticipate potential future price movements. By observing how price interacts with the trendline (bouncing off it or breaking through it), traders can make informed decisions about potential support and resistance levels, informing their entry and exit points for trades.
How do Trendlines represent Price Movements?
Trendlines in forex trading depict price movements by establishing support and resistance zones. In an uptrend, the line acts as support, suggesting buying pressure if the price falls towards it. Conversely, a downtrend line acts as resistance, indicating potential selling pressure if the price nears it. The trendline’s angle and consistency also reveal trend strength – steeper lines suggest stronger trends likely to continue, while flatter lines hint at weaker trends prone to reversals. Finally, price breakouts above an uptrend line or below a downtrend line signal potential continuations or reversals of the trend, respectively.
What are the different Types of Trendlines?
While the core concept of trendlines involves connecting swing highs or lows, forex traders have a few different options at their disposal depending on the specific context and information they seek to extract. Here’s a breakdown of the most common types of trendlines:
- Standard Trendlines: These are the classic trendlines, connecting a series of swing highs (uptrend) or swing lows (downtrend) to depict the overall directional bias. Standard trendlines offer a clear visual representation of the trend’s strength and potential support or resistance zones.
- Channel Trendlines: In contrast to standard trendlines that depict a single directional bias, channel trendlines involve drawing two trendlines, one connecting the highs and another connecting the lows. This creates a channel within which the price tends to fluctuate. The width of the channel can indicate trend volatility – narrower channels suggest a more constrained price movement, while wider channels might indicate higher price swings within the overall trend.
- Trendline Extensions: Once a valid trendline is established, traders can project it forward to estimate potential future price movements. In an uptrend, extending the trendline upwards can indicate areas of potential resistance, while extending a downtrend line downwards can suggest zones of potential support. It’s important to remember that these extensions are hypothetical and should be used in conjunction with other technical analysis tools for confirmation.
What are the Key Factors to consider when drawing Trendlines on a Forex Chart?
While trendlines appear straightforward, meticulous attention to detail ensures they accurately represent price movements and offer valuable insights. Here are key factors to consider when drawing trendlines on a forex chart:
- Number of Touchpoints: A valid trendline should connect at least two, but ideally more, swing highs (uptrend) or swing lows (downtrend). The more touchpoints the line has, the stronger the underlying trend and the more reliable the support or resistance zones it establishes.
- Timeframe Selection: The timeframe you choose for your chart analysis significantly impacts the trendline’s validity. Generally, trendlines drawn on higher timeframes (e.g., daily or weekly charts) tend to be more reliable than those on lower timeframes (e.g., hourly or 15-minute charts) which can be more susceptible to noise and short-term fluctuations.
- Trendline Angle: The angle of the trendline can indicate the strength of the trend. Steeper trendlines suggest a stronger trend with a higher likelihood of continuation. Conversely, flatter trendlines might indicate a weaker trend or a potential trend change.
- Price Action at the Trendline: Observe how the price interacts with the trendline. Does it bounce off it repeatedly, or does it break through decisively? Price bouncing off the line suggests the trend might hold, while a clean break above an uptrend line or below a downtrend line could signal a potential trend reversal.
- Confirmation with Other Indicators: While trendlines offer valuable insights, they shouldn’t be used in isolation. Look for confirmation from other technical indicators like moving averages or relative strength index (RSI) to strengthen the validity of the trendline and potential support or resistance zones.
How many Price points are typically needed to draw a Valid Trendline?
Trendlines offer a valuable tool for understanding price movements and potential future trends. However, a critical question arises: how many price points are actually needed to draw a valid trendline?
The answer isn’t a rigid number, but rather a balance between practicality and reliability. Technically, you could connect just two swing highs (uptrend) or lows (downtrend) to form a basic trendline. However, such a line wouldn’t hold much weight. A trendline with only two touchpoints is highly susceptible to random market fluctuations and offers minimal support or resistance levels.
For a trendline to be considered valid and offer reliable insights, it’s generally recommended to connect at least three swing highs/lows. With three touchpoints, the line starts to depict a clearer directional bias and establishes more concrete support/resistance zones. The more touchpoints a trendline has, the stronger the underlying trend it represents. A trendline connecting four or even five swing points becomes even more reliable, indicating a well-established trend with more defined support and resistance levels.
Remember, the number of touchpoints isn’t the sole factor. The timeframe of your chart also plays a role. Trendlines on higher timeframes (daily, weekly) with fewer touchpoints can still be significant due to the compressed nature of price movements on those timeframes. Conversely, trendlines on lower timeframes (hourly, 15-minute) might require more touchpoints to account for the higher volatility and potential for noise in the data.
What are some Common Mistakes to avoid when drawing Trendlines?
Trendlines are a valuable tool for forex traders, offering insights into price movements and potential future trends. However, if not drawn with proper care, they can lead to misleading signals and costly trading decisions. Here’s a breakdown of common mistakes to avoid:
The Two-Point Trap: The allure of simplicity can be tempting, but connecting just two swing highs or lows for your trendline is a recipe for disaster. Such a line offers minimal support or resistance and is easily swayed by random market fluctuations. Aim for at least three touchpoints to establish a more reliable trend direction and identify stronger support/resistance zones.
Timeframe Mismatch: Trendlines drawn on hourly charts with numerous touchpoints might seem convincing, but they may not translate to higher timeframes like daily or weekly charts. Price movements on lower timeframes are more erratic, and trendlines based on them can be misleading. Focus on higher timeframes for a clearer picture of the underlying trend. If you do use trendlines on lower timeframes, be cautious and seek confirmation with a higher number of touchpoints.
The Forcing Game: Sometimes, the price action might not conform perfectly to a clear trendline. Resist the urge to manipulate the line to fit your desired narrative. A trendline should emerge naturally from the price action, not the other way around. If the price keeps breaking through your trendline, it might be a sign that the trend is weakening or even reversing course altogether.
Solo Act Syndrome: While trendlines offer valuable insights, they shouldn’t be the only tool in your technical analysis toolbox. Always seek confirmation from other technical indicators like moving averages, oscillators, or volume analysis. Combining trendlines with other tools strengthens the validity of the identified support/resistance zones and potential trend direction.
Overconfidence in the Crystal Ball: Projecting a trendline forward to anticipate future price movements can be a helpful exercise, but don’t mistake it for a crystal ball. The market is dynamic, and prices can deviate from projected paths. Use trendline extensions cautiously, and be prepared to adapt your trading strategy if the price action deviates significantly.
How can Slope and Angle of a Trendline provide insights into the Strength of a Trend?
Trendline slopes offer a window into forex trend strength. Steeper slopes, like a highway on-ramp in an uptrend, indicate strong momentum and a likely continuation of the trend. Prices face less resistance as they climb the trend. Conversely, a steep downtrend suggests a one-way street downwards.
Flatter slopes signal weaker trends. In an uptrend, a gentle incline might indicate a trend losing steam or nearing consolidation. A flat downtrend line hints at weakening selling pressure, potentially leading to a trend reversal or sideways movement.
A change in slope is like a highway exit or tollbooth. A flattening uptrend suggests a potential trend reversal, while a downtrend line flattening or sloping upwards might signal a reversal due to buying pressure.
How do Trendlines Signal Potential Support and Resistance Levels in the Forex Market?
Trendlines act as more than just visual representations of price movements. They serve a crucial role in identifying potential support and resistance levels, allowing traders to anticipate price action and make informed trading decisions. Here’s how trendlines signal these key zones:
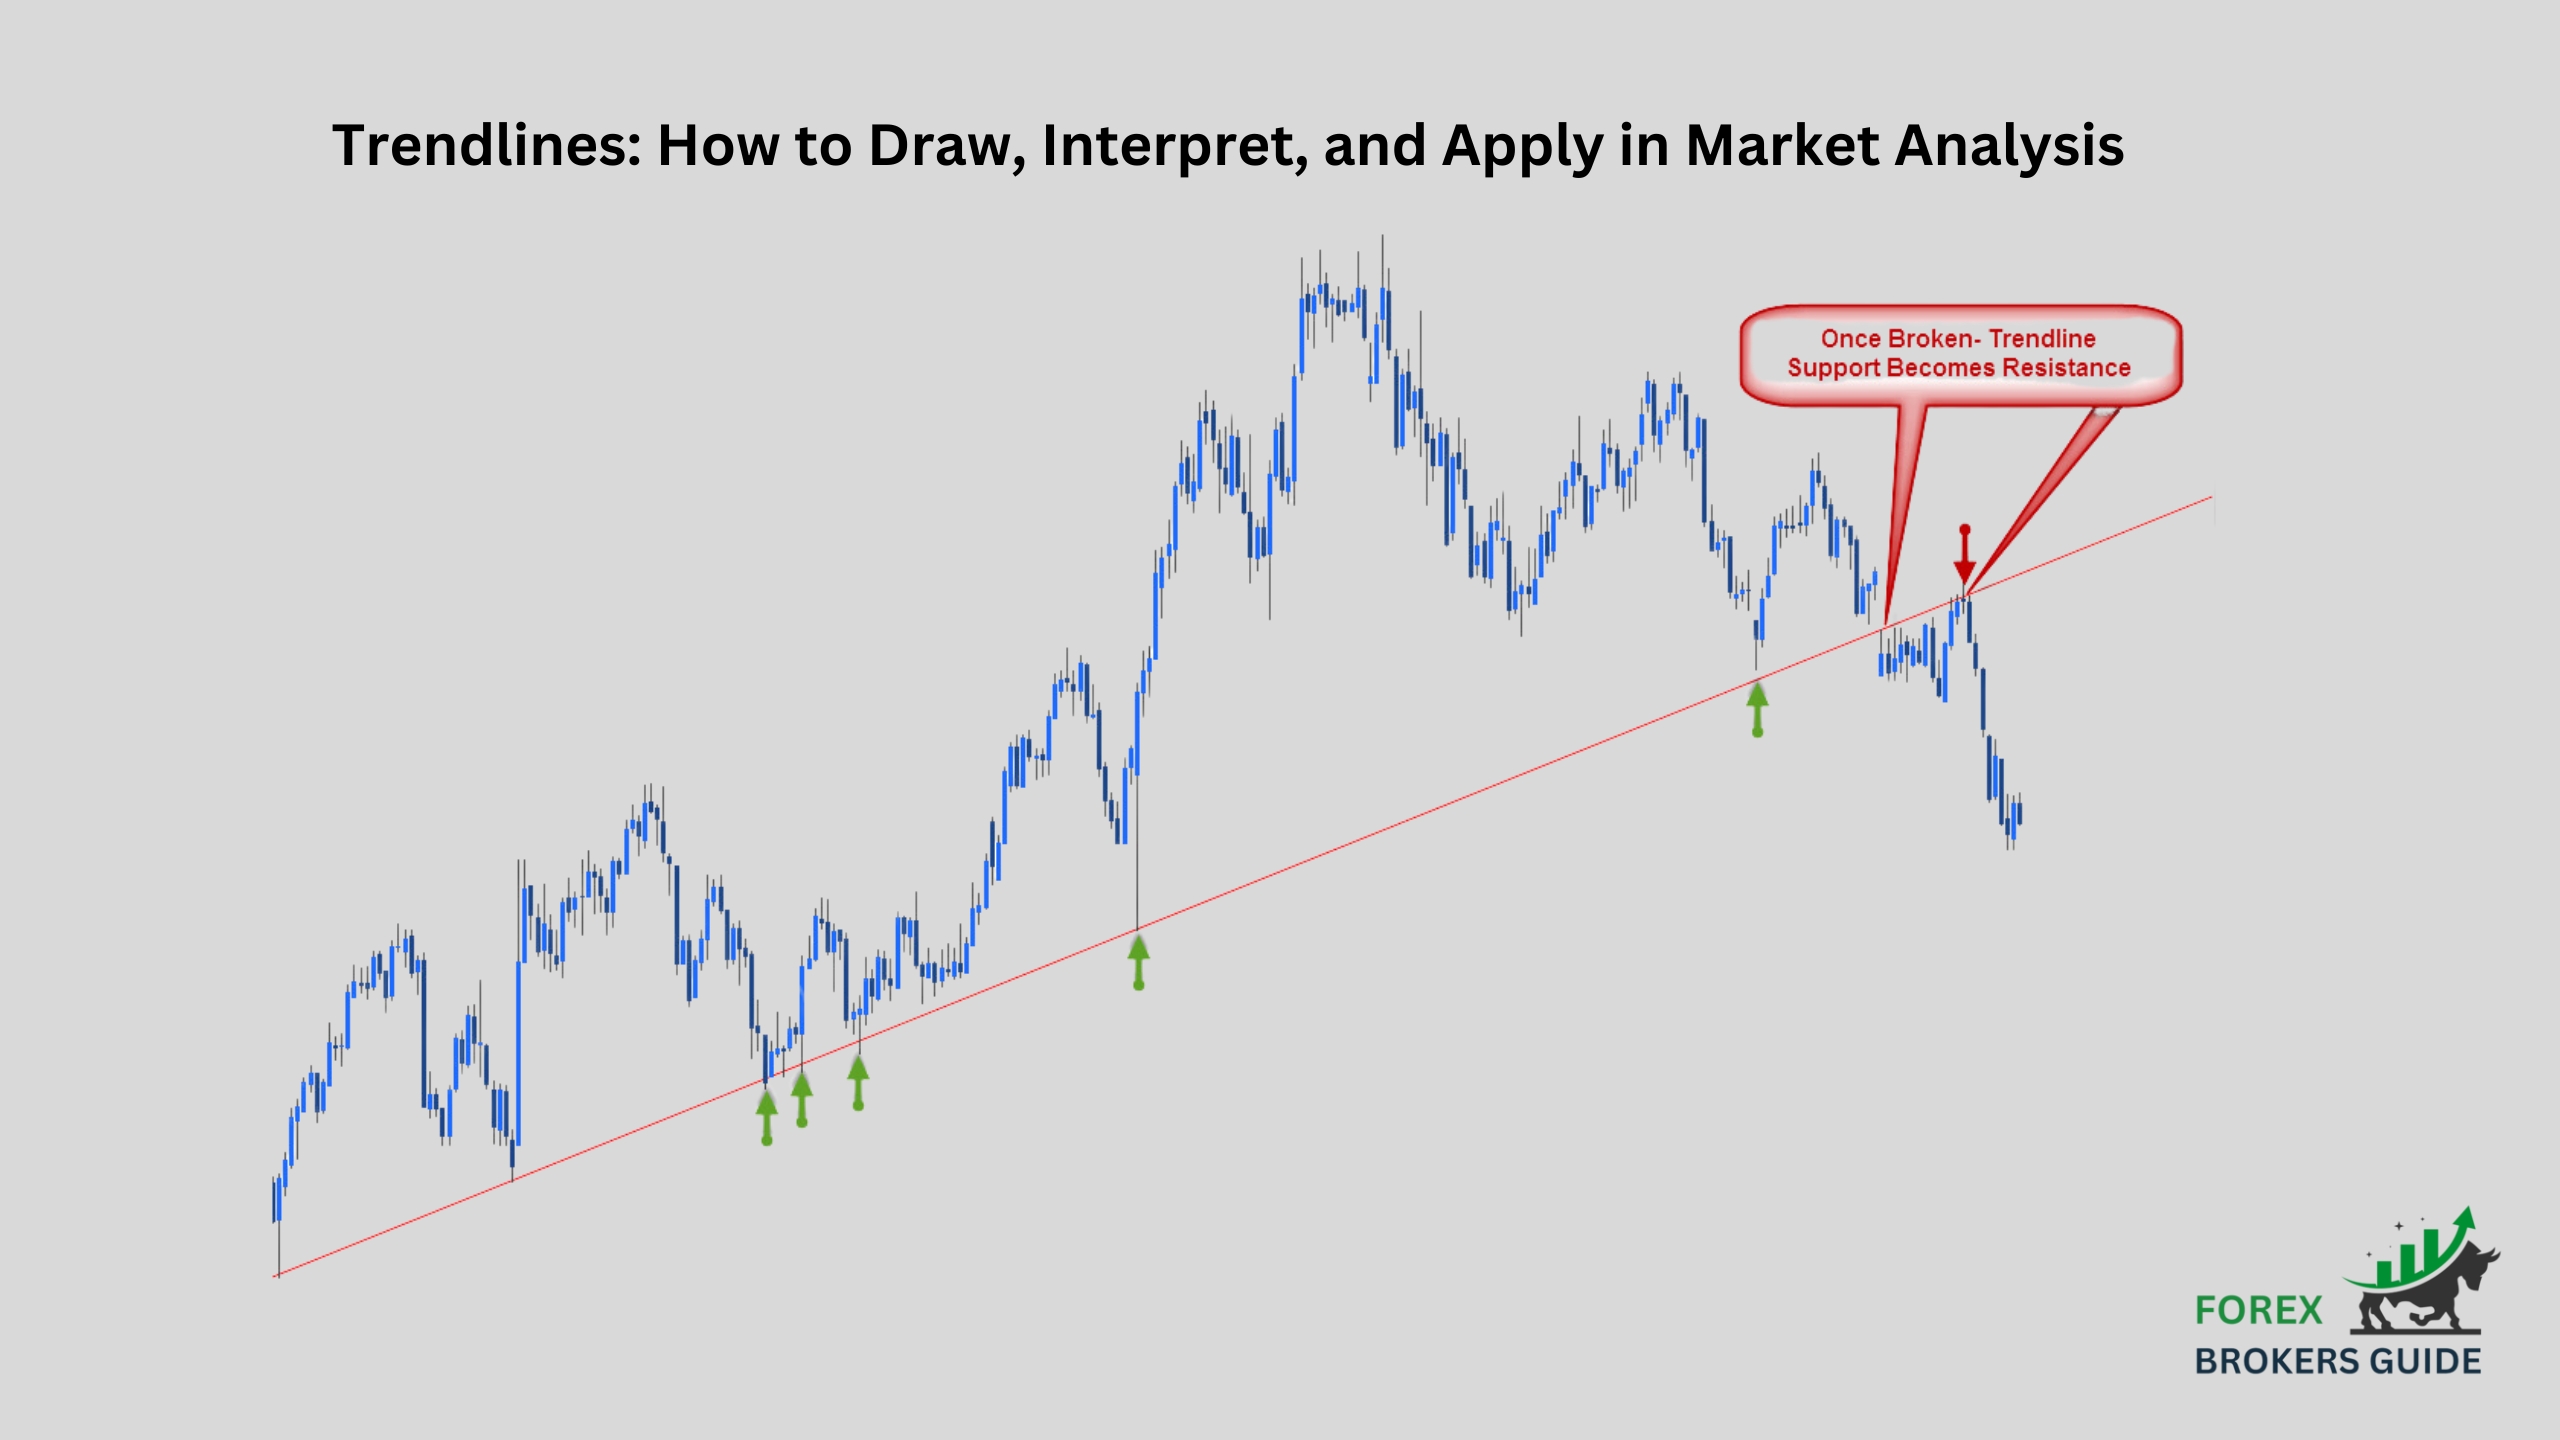
Uptrend Support: Imagine a rising price trend depicted by a trendline. This line acts as a psychological support level. As the price approaches the trendline from below during an uptrend, it might encounter buying pressure from traders who believe the uptrend will hold. This buying pressure can potentially push the price back up and continue the uptrend. The more times the price bounces off the trendline without breaking below it, the stronger the support level becomes.
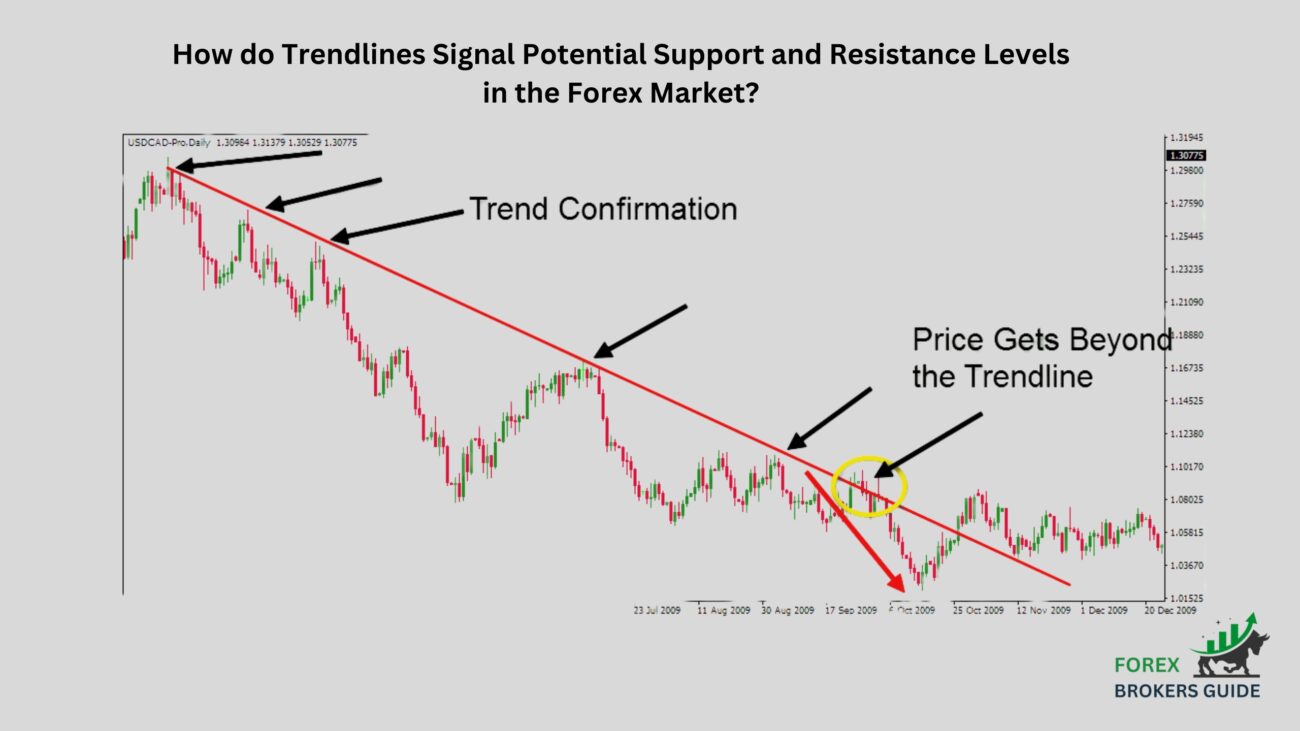
Downtrend Resistance: Conversely, in a downtrend, the trendline acts as a resistance level. As the price approaches the trendline from above, it might face selling pressure from traders who believe the downtrend will continue. This selling pressure can potentially push the price back down and maintain the downtrend. The more times the price touches the trendline without breaking above it, the stronger the resistance level becomes.
Price Action at the Trendline: The way price interacts with the trendline offers valuable clues. A clean break above an uptrend line or below a downtrend line suggests a potential trend reversal. Conversely, price bouncing off the trendline repeatedly strengthens the support or resistance zone and increases the likelihood that the trend will continue.
Confirmation from Other Indicators: While trendlines offer valuable insights, they shouldn’t be used in isolation. Look for confirmation from other technical indicators like moving averages, relative strength index (RSI), or volume analysis. For instance, an uptrend line coinciding with a support level on a moving average and rising volume can offer a strong signal for continued buying pressure.
By understanding how trendlines signal support and resistance, forex traders can:
- Identify Entry and Exit Points: Support zones can be good entry points for long positions (buying) in an uptrend, while resistance zones can be good entry points for short positions (selling) in a downtrend. Conversely, a break above an uptrend line might signal an exit from a long position, while a break below a downtrend line might signal an exit from a short position.
- Manage Risk: Knowing potential support and resistance zones allows traders to place stop-loss orders strategically, limiting potential losses if the price movement goes against their trade.
How can breakouts above or below a trendline indicate Potential Trend Reversals or Continuations?
Trendline breakouts hold the potential to signal either trend reversals or continuations in the forex market. A breakout above an uptrend line suggests a surge in buying pressure, potentially leading to a continuation of the uptrend with increased momentum. Conversely, a break below a downtrend line indicates a surge in selling pressure, potentially triggering a trend reversal to the upside. However, it’s crucial to observe price action after the breakout. If the price sustains its move above the uptrend line or below the downtrend line, the breakout gains validity. Conversely, if the price quickly falls back within the trendline boundaries, the breakout might be a false signal and the original trend could resume.
What are the Limitations of Relying Solely on Trendlines for Making Trading Decisions?
While trendlines offer a valuable tool for forex traders, relying solely on them for trading decisions has limitations. Here’s why:
- Subjectivity: Drawing trendlines can be subjective, with different traders potentially drawing them in slightly different places. This subjectivity can lead to misinterpretations of support and resistance levels, and ultimately, faulty trading decisions.
- False Signals: Trendlines can generate false signals, particularly during periods of consolidation or choppy price movements. Prices might touch the trendline and bounce back without a true trend reversal, or they might break through the line only to return within the trend shortly after. This can lead traders to enter or exit positions at inopportune moments.
- Limited Information: Trendlines only reflect past price movements and don’t account for external factors that can significantly impact forex markets, such as economic data releases, central bank policy pronouncements, or geopolitical events. These factors can cause price movements to deviate from established trends, rendering trendline analysis less effective.
How can Forex Traders incorporate Trendlines into their Trading Strategies for Entry and Exit points?
Trendlines are more than just visual aids on a forex chart; they can be powerful tools for incorporating strategic entry and exit points into your trading plan. Here’s how to leverage trendlines for informed decisions:
Identifying Support and Resistance: As discussed earlier, trendlines establish potential support and resistance zones. In an uptrend, the trendline acts as support. Look for opportunities to enter long positions (buying) near the trendline, especially if the price bounces off it repeatedly. Conversely, in a downtrend, the trendline acts as resistance. You can enter short positions (selling) near the trendline, particularly if it holds firm after multiple price touches.
Breakout Confirmation: While a trendline can indicate potential support or resistance, a breakout above an uptrend line or below a downtrend line can signal a trend continuation or reversal, respectively. However, be cautious of false breakouts. Only consider a breakout valid if the price sustains its move above the uptrend line (upward continuation) or below the downtrend line (potential reversal). This sustained price movement suggests a shift in market sentiment that favors the breakout direction.
Confirmation with Other Indicators: Remember, trendlines are just one piece of the puzzle. Always look for confirmation from other technical indicators like moving averages, relative strength index (RSI), or volume analysis. For instance, consider entering a long position near the support zone of a trendline in an uptrend if it coincides with a support level on a moving average and rising volume. This confluence of signals strengthens the potential for a continued uptrend.
Stop-Loss Placement: Knowing potential support and resistance zones allows you to place stop-loss orders strategically. A stop-loss order automatically exits your trade if the price moves against you, limiting potential losses. In a long position near a trendline support, your stop-loss could be placed just below the trendline. Conversely, for a short position near a downtrend line resistance, your stop-loss could be placed just above the trendline.
Profit Targets: While trendlines can guide entry points, they can also suggest potential profit targets. In an uptrend, aim to take profits when the price nears the next resistance level (potentially another trendline or a moving average resistance zone). Conversely, in a downtrend, aim to take profits when the price approaches the next support level.
How can Trendlines be used in Conjunction with other Technical Indicators for confirmation and better Analysis?
Trendlines are a powerful tool in forex trading, but they shine even brighter alongside other technical indicators. Moving averages solidify support and resistance zones, while momentum indicators like RSI help identify potential trend reversals based on buying or selling pressure. Volume analysis adds another dimension, confirming the significance of breakouts with high volume signaling a stronger shift in market sentiment. By combining trendlines with these technical tools, forex traders gain a more comprehensive market view, leading to better-informed entry and exit decisions.
How can Support and Resistance Levels identified by Trendlines be used for placing Stop-loss and Take-profit orders?
Trendlines, beyond simply depicting trends, transform into powerful tools for forex traders when it comes to stop-loss and take-profit orders. Understanding how to leverage support and resistance zones identified by trendlines allows for a strategic dance between risk management and profit targeting.
Stop-Loss: A Calculated Retreat
- Uptrend: Imagine the trendline as a safety net in an uptrend. Place your stop-loss order for a long position (buying) just below the trendline. This ensures a controlled exit if the price unexpectedly plunges through support, potentially signaling a weakening or reversing uptrend. As the uptrend progresses, consider trailing your stop-loss upwards. This allows you to lock in profits while maintaining some flexibility to capture further gains.
- Downtrend: The trendline flips from support to resistance in a downtrend. Your stop-loss for a short position (selling) goes just above the trendline. This limits your potential losses if the price unexpectedly surges past resistance, hinting at a potential trend reversal. As the downtrend deepens, consider trailing your stop-loss downwards to lock in profits.
Take-Profit: Seizing the Opportunity
- Uptrend: With a keen eye, identify potential profit-taking opportunities near the next identifiable resistance level. This resistance could be another trendline, a historical price ceiling, or a resistance zone on a moving average indicator. Exiting near these resistance zones allows you to capture profits before the uptrend encounters selling pressure and potentially reverses.
- Downtrend: Look for potential profit zones near the next identifiable support level. This support could be another trendline, a historical price floor, or a support level on a moving average indicator. Taking profits near these support zones allows you to capitalize on the downtrend before the price encounters potential buying pressure and the trend might weaken or reverse.
A Word to the Wise
- Volatility’s Impact: Market gyrations can be unpredictable. In volatile times, consider placing stop-loss orders with a slightly wider buffer around the support/resistance identified by trendlines. This extra breathing room reduces the risk of getting stopped out due to short-term price swings.
- Risk-Reward Ratio: The Guiding Principle Always strive for a favorable risk-reward ratio in your trades. The potential profit you target should ideally outweigh the potential loss you risk. When using trendlines for stop-loss and take-profit placement, ensure the distance between your entry price and the take-profit target is larger than the distance between your entry price and the stop-loss level.
What are some Advanced Trendline Techniques like Parallel channels and Trendline breaks with Retests?
Trendlines offer valuable insights for forex traders, but venturing beyond the fundamental uptrend and downtrend lines can unlock even greater analytical power. Here, we explore two advanced trendline techniques: parallel channels and trendline breaks with retests.
Parallel Channels: Confinement and Expansion
Imagine two trendlines drawn parallel to each other, one above the price action and one below. This creates a price channel, a valuable tool for identifying consolidation phases and potential breakouts.
- Consolidation: During periods of price consolidation, the price tends to move within the confines of the parallel channel. This suggests a temporary pause in the trend as buyers and sellers wrestle for control. Identifying these channels can help traders anticipate potential breakout opportunities.
- Breakouts: A clean break above the upper trendline of a price channel in an uptrend can signal a surge in buying pressure and a potential continuation of the uptrend with increased momentum. Conversely, a break below the lower trendline of a price channel in a downtrend can indicate a surge in selling pressure and a potential trend continuation to the downside.
Trendline Breaks with Retests: Confirmation or False Alarm?
A trendline break, whether above an uptrend line or below a downtrend line, can be a significant indicator. However, not all breakouts are created equal. Here’s where retests come in:
- Breakout Confirmation: A clean break above an uptrend line, followed by a price move that revisits the trendline (retest) and then continues upwards, strengthens the validity of the breakout. This retest suggests temporary profit-taking by early bulls before the uptrend resumes with renewed vigor. Similarly, a break below a downtrend line followed by a retest that fails to hold and leads to further price decline strengthens the downtrend.
- False Breakouts: Not all breakouts are genuine. Sometimes, the price might pierce the trendline but quickly fall back within the trend’s boundaries. This can be a false breakout, and the original trend might resume.
Combining Techniques for Powerful Analysis
The true power of these advanced trendline techniques lies in their synergy. Imagine a price channel in an uptrend. A breakout above the upper trendline followed by a successful retest suggests a strong continuation of the uptrend. This confluence of signals strengthens the case for entering long positions (buying) or holding existing long positions with increased confidence.
How can Forex Traders utilize Trendlines to identify potential Price Targets within a Trend?
Trendlines help forex traders envision potential price targets within a trend. In an uptrend, look for resistance levels that could act as profit targets. These could be another trendline, horizontal resistance zones from historical price action, or resistance levels on moving averages. Conversely, in a downtrend, identify support zones as potential take-profit areas. These could be another trendline, historical support levels, or support levels on moving averages. By strategically placing take-profit orders near these identified resistance/support zones, traders can aim to capture profits before the trend encounters opposing forces and potentially reverses.
How do dynamic Trendlines, adjusted over time, adapt to evolving Market Conditions?
Unlike static trendlines, dynamic trendlines adapt to the evolving forex market. They adjust over time using tools like moving averages or pivot points, allowing them to capture the nuances of changing trends and potentially offer earlier signals of trend reversals. This adaptability makes them valuable for traders seeking a more dynamic approach to trend analysis and potential turning points in the market. However, subjectivity in drawing these lines and the possibility of false signals necessitate using them alongside other technical indicators for a comprehensive trading strategy.