
In the ever-changing world of forex, identifying the underlying trend is a crucial skill for successful trading. A trend refers to the dominant direction in which the price of a currency pair moves over a specific period. It can be upward (bullish), downward (bearish), or sideways (rangebound). Understanding these trends allows traders to make informed decisions about entering and exiting positions to potentially capitalize on price movements.
Identifying a trend can be achieved through various technical analysis tools. One common method is by using trend lines. These lines are drawn by connecting at least two swing lows (in an uptrend) or swing highs (in a downtrend). The steeper the trend line, the stronger the trend is considered to be. Additionally, traders can utilize moving averages, which smooth out price fluctuations and reveal the overall trend direction. By studying historical price movements and employing these tools, forex traders can gain valuable insights into the prevailing trend and make informed trading decisions aligned with that trend.
Table of Contents
What is Trend Analysis in Forex Trading?
Trend analysis is the process of identifying the dominant direction in which a currency pair’s price is moving over a specific timeframe. This directional bias can be upward (bullish), downward (bearish), or sideways (rangebound). By understanding the prevailing trend, forex traders can make informed decisions about entering and exiting positions to potentially capitalize on price movements aligned with the trend’s direction.
What are the different Types of Trends (uptrend, downtrend, sideways)?
Forex traders navigate three main trend types: uptrends, downtrends, and sideways trends. Each offers distinct characteristics and trading opportunities.
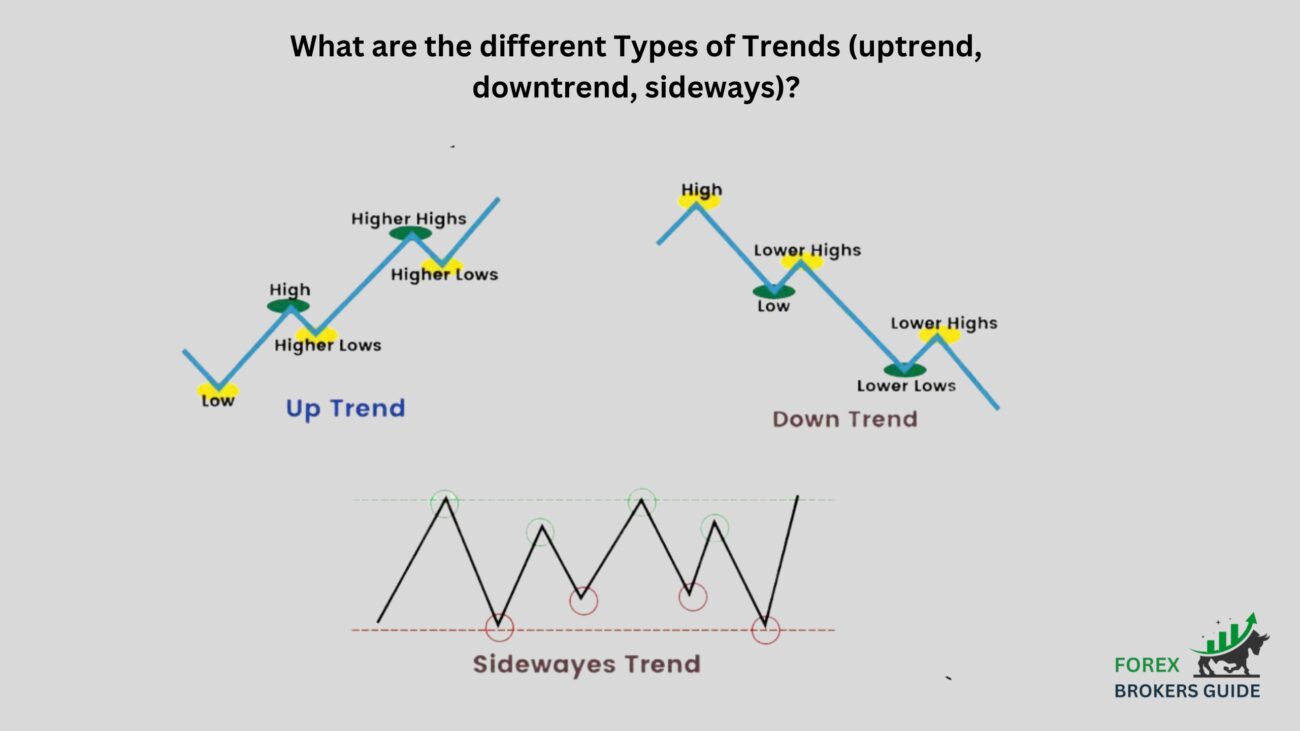
Uptrend (Bullish Trend): An uptrend is characterized by a series of higher highs and higher lows. As the name suggests, the overall price movement is upward over time. This can be a lucrative time for traders who go “long” on a currency pair, essentially betting on its value to continue increasing.
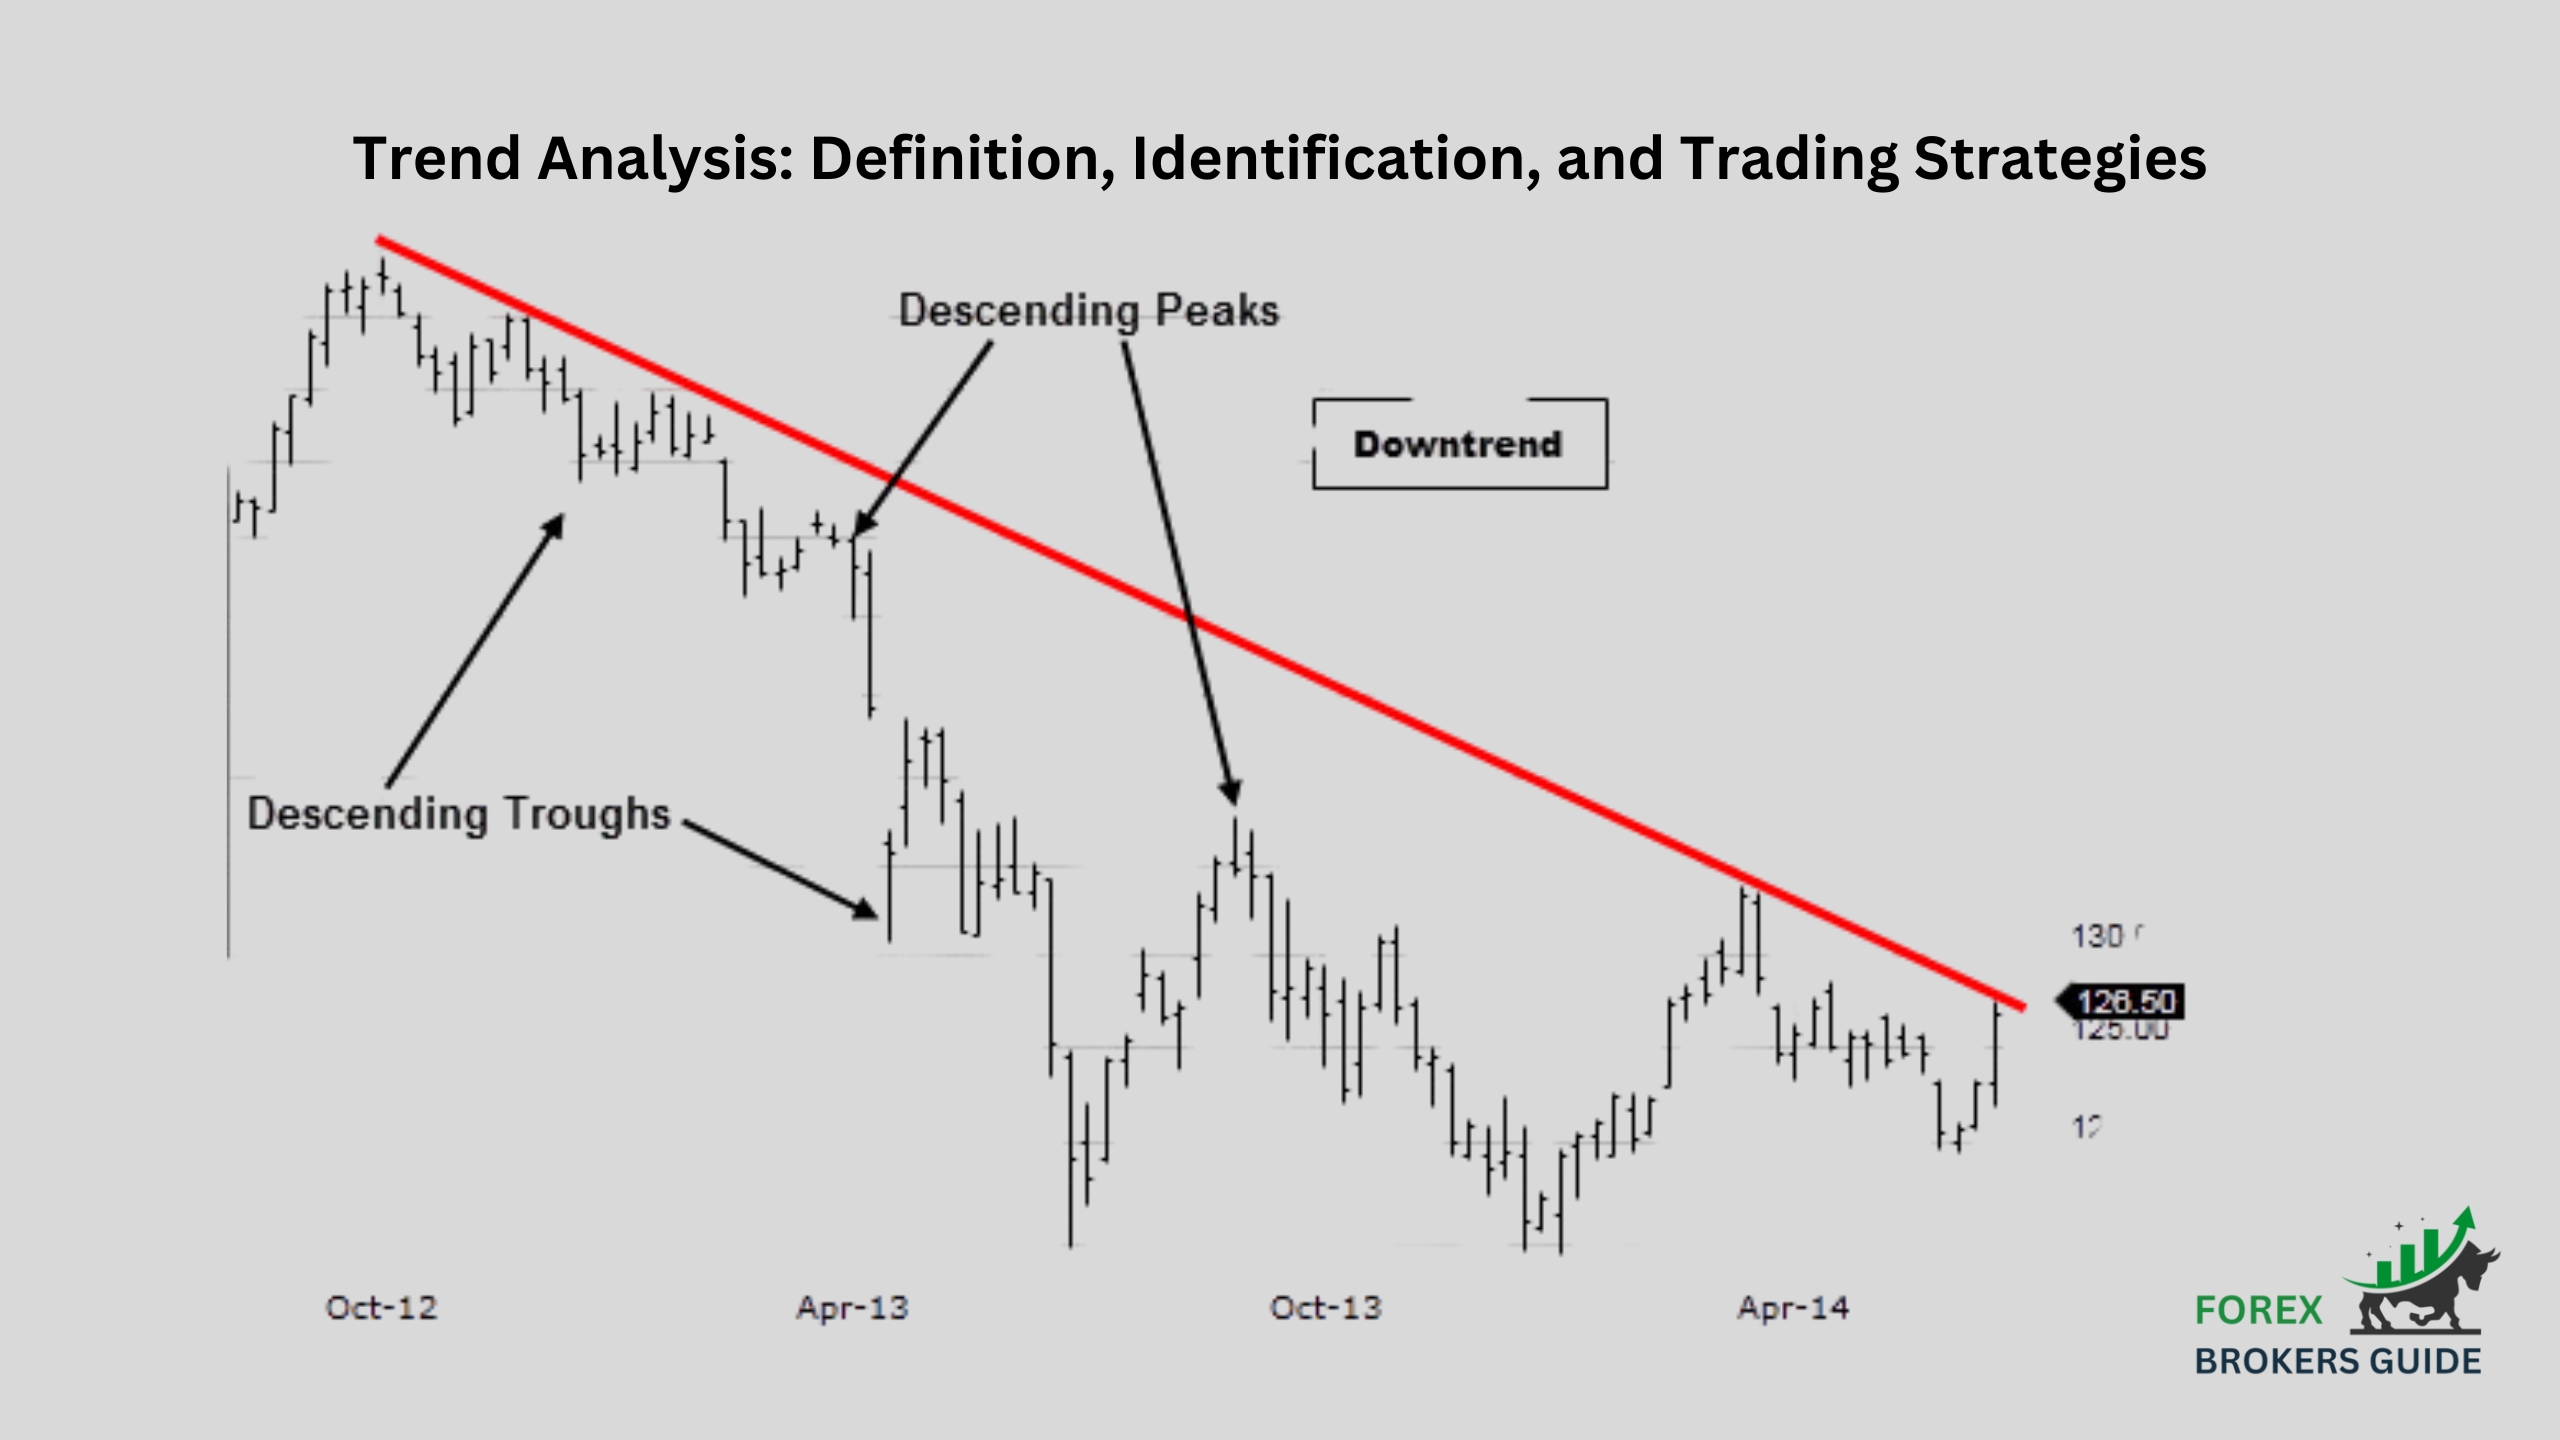
Downtrend (Bearish Trend): A downtrend is the opposite of an uptrend, marked by a series of lower highs and lower lows. The overall price movement is downward, presenting an opportunity for traders to go “short” on a currency pair, profiting if its value depreciates.
Sideways Trend (Rangebound Trend): In a sideways trend, the currency pair’s price fluctuates within a specific range, with no clear upward or downward bias. While these trends might not offer significant directional movements, experienced traders can still capitalize on these fluctuations using strategies like breakout trades, anticipating potential price movements outside the established range.
How can forex traders identify trends using technical analysis tools like price charts and trendlines?
Forex traders can identify trends using a combination of price charts and trendlines, which are technical analysis tools. By analyzing price movements on charts, traders can look for:
- Higher Highs and Lows (Uptrend): In an uptrend, each subsequent peak (high) is higher than the previous one, and each valley (low) is also higher than the prior low.
- Lower Highs and Lows (Downtrend): Conversely, in a downtrend, each high point is lower than the one before it, and each low point is also lower than the preceding low.
- Price Consolidation: Periods of price consolidation, where the price fluctuates within a specific range, can sometimes precede a breakout in the direction of the prevailing trend.
Once these patterns are identified, traders can draw trendlines to visualize the trend’s direction. A trendline in an uptrend connects at least two consecutive swing lows, sloping upwards. Conversely, a trendline in a downtrend connects at least two consecutive swing highs, sloping downwards. The steeper the trendline, the stronger the trend is generally considered to be.
What are the Limitations of relying solely on Trend Analysis for making Forex Trading Decisions?
While trend analysis is a valuable tool in a forex trader’s arsenal, it’s important to acknowledge its limitations. Here’s why relying solely on trend analysis can be a risky proposition:
- Future Price Uncertainty: Trend analysis primarily focuses on historical price movements. However, past performance doesn’t guarantee future results. Markets are inherently unpredictable, and unexpected events like political turmoil, economic crises, or central bank policy changes can disrupt established trends and trigger sharp reversals.
- False Signals and Trend Inconsistencies: Not all trends are clear-cut and persistent. Markets can experience periods of consolidation or choppy price action, making it difficult to identify a definitive trend direction. Additionally, trendlines can be subjective, and minor price movements can create false signals or breakouts that fizzle out quickly.
- Trend Maturity and Trend Exhaustion: Trends don’t last forever. Uptrends eventually mature and become vulnerable to corrections or reversals. Similarly, downtrends can lose momentum and flatten out. Relying solely on trend analysis without considering factors like price momentum or overbought/oversold conditions can lead traders to miss these signals and hold onto losing positions.
- Ignoring Other Market Factors: The forex market is influenced by a multitude of factors beyond price movements. Fundamental factors like economic data releases, interest rate decisions, and geopolitical events can significantly impact currency valuations. Forex traders who solely focus on trend analysis might miss out on crucial information that could influence the direction of their trades.
How can Moving Averages be used to confirm and Potentially predict Future Trends?
Moving averages (MAs) are powerful technical analysis tools forex traders can utilize to confirm existing trends and potentially predict future ones. Here’s how they work:
- Smoothing Out Price Noise: MAs calculate the average price of a currency pair over a chosen period (e.g., 50 days, 200 days). This helps smooth out short-term price fluctuations and reveal the underlying trend direction.
- Confirming Trends: The position of the price relative to the moving average can be a good indicator of the prevailing trend. If the price consistently trades above a rising MA, it suggests an uptrend. Conversely, a price consistently below a falling MA suggests a downtrend.
- Identifying Trend Strength: The slope of the moving average also provides insights into trend strength. A steeper slope indicates a stronger trend, while a flatter slope suggests a weaker trend or potential consolidation.
- Predicting Future Trends: While not foolproof, breakouts above or below a moving average can sometimes signal potential future trends. For example, a sustained price move above a rising MA might suggest the uptrend has room to continue. Conversely, a price breaking below a falling MA could indicate a potential continuation of the downtrend.
What role do Momentum Indicators play in Identifying the Strength and continuation of a Trend?
Trend analysis is king, but not all trends are created equal. Some trends chug along steadily, while others surge forward with explosive momentum. This is where momentum indicators come into play. These technical analysis tools help forex traders gauge the strength and potential continuation of a trend, allowing them to identify trends with the most vigor and profit potential.
Momentum indicators don’t predict the direction of a trend itself, but rather the speed and intensity behind the price movement. Here’s how they work:
- Measuring Rate of Change: Momentum indicators compare a currency pair’s current price to its price in a previous period. This helps quantify the rate of change and identify periods of accelerating or decelerating price movements.
- Identifying Trend Strength: Strong momentum indicators often accompany strong trends. For example, a rising Relative Strength Index (RSI) alongside rising prices suggests a trend with significant upward momentum, potentially indicating room for further price increases.
- Overbought and Oversold Conditions: Some momentum indicators, like the RSI or Stochastic Oscillator, have defined ranges. When these indicators reach extreme highs, it might suggest the market is overbought, hinting at a potential trend reversal. Conversely, reaching extreme lows might indicate oversold conditions, potentially signaling a trend continuation as the market corrects and bounces back.
How can forex traders combine different technical indicators for a more comprehensive trend analysis?
To gain a more comprehensive understanding of trends and make informed trading decisions, forex traders should combine different technical indicators. This synergistic approach, when used effectively, can empower traders to navigate the complexities of the market and identify trends with higher confidence.
The foundation of any good trend analysis is a solid understanding of the overall trend direction. Here, tools like moving averages and trendlines come into play. These indicators help forex traders establish whether the price of a currency pair is in an uptrend, downtrend, or sideways trend.
Once the trend is identified, momentum indicators like the Relative Strength Index (RSI) or Stochastic Oscillator can be layered on to reveal the trend’s strength and potential continuation. A rising RSI alongside rising prices in an uptrend suggests strong upward momentum, potentially indicating room for further price increases.
However, the goal isn’t just to ride the trend; it’s also to identify potential turning points. Oscillators like the RSI or MACD (Moving Average Convergence Divergence) can sometimes provide early warnings of these reversals. Divergence occurs when the indicator doesn’t confirm the price movement. For instance, in an uptrend, if the price keeps making new highs but the RSI starts forming lower highs, it might suggest a weakening trend and a potential reversal to the downside.
Incorporating support and resistance levels, identified by historical price movements, can further strengthen the analysis. These levels can act as potential turning points for trends. If a price consistently bounces off a support level in a downtrend, it might indicate a potential trend reversal to the upside. Conversely, a price repeatedly rejected at a resistance level in an uptrend could suggest a trend reversal to the downside.
The key to successfully combining indicators lies in using them for confirmation, not prediction. No single indicator is a crystal ball, and relying solely on one source of information can lead to costly mistakes. By using a combination of indicators, forex traders can confirm signals and avoid making decisions based on incomplete data.
It’s also important to remember that different currency pairs and market conditions might favor specific technical indicators. Experimentation and backtesting strategies are crucial to identify a combination that works best for your trading style and the specific market you’re analyzing. However, be wary of information overload. Stick to a manageable number of indicators that complement each other and provide a clear overall picture of the trend.
What are some Effective Trading Strategies for Entering and Exiting trades based on Identified Trends?
Identifying trends is a cornerstone of successful forex trading. But simply spotting a trend isn’t enough. The real challenge lies in capitalizing on it by entering and exiting trades at optimal points. Here, we explore effective trading strategies that forex traders can utilize to maximize their profits while navigating trending markets.
The key to profiting from a trend is to enter trades in its direction. One approach involves capitalizing on breakouts. Following a period of consolidation, a breakout above a resistance level in an uptrend or below a support level in a downtrend can signal a continuation of the trend’s momentum. This presents an opportunity for traders to enter long positions (buying) on uptrend breakouts, aiming to benefit from the anticipated price increase. Conversely, during downtrends, entering short positions (selling) on breakouts below support allows traders to profit if the price continues to decline.
However, trends rarely move in a straight line. Healthy trends often experience temporary pullbacks or retracements, where the price dips slightly before resuming its upward or downward trajectory. These pullbacks can be advantageous entry points for skilled traders. By going long in an uptrend during a pullback (buying at a lower price), or going short in a downtrend (potentially securing a better entry price), traders can maximize their potential profits. It’s crucial to remember though, that confirmation from other technical indicators is essential to avoid false breakouts or failed pullbacks that could lead to losses.
Knowing when to exit a trade is just as important as knowing when to enter. The goal is to lock in profits while minimizing potential losses if the trend reverses. Trailing stop-loss orders are a valuable tool in this regard. These orders automatically adjust the stop-loss price as the trend moves favorably. This allows traders to capture profits as the price increases in an uptrend or decreases in a downtrend. However, if the trend reverses, the stop-loss order automatically exits the trade, limiting potential losses.
Another strategy involves setting predetermined profit targets based on technical analysis or risk-reward ratios. This helps traders avoid the trap of greed and ensures they exit the trade at a pre-defined level of profitability, even if the trend has further room to run.
Finally, no trend lasts forever. It’s essential for traders to identify signs of trend exhaustion, such as flattening moving averages, overbought/oversold readings on momentum indicators, or a reversal in price action. These signals might indicate a potential trend reversal, prompting traders to exit their positions before they incur losses.
How can Forex Traders manage Risk using Stop-loss Orders within a trend-following Strategy?
Stop-loss orders are a crucial risk management tool for forex traders, especially within trend-following strategies. Here’s how they help:
- Limit Losses: By placing a stop-loss order below the current price in an uptrend or above the current price in a downtrend, you predetermine the maximum amount you’re willing to lose on a trade. If the market moves against your position and reaches the stop-loss price, the trade automatically closes, limiting your potential losses.
- Protect Profits: Trailing stop-loss orders can be particularly beneficial in trend-following strategies. These orders automatically adjust the stop-loss price as the trend moves in your favor, allowing you to lock in profits while still providing a buffer against sudden reversals.
- Maintain Discipline: Stop-loss orders help instill discipline by taking the emotion out of trading. You pre-define your risk tolerance and avoid the temptation to hold onto losing positions in the hope of a turnaround.
How can Profit-taking Strategies be incorporated to Capture Gains while a Trend Persists?
The thrill of riding a strong trend in forex trading can be exhilarating. But knowing when to capture those profits and secure your gains is just as important as identifying the trend itself. Here’s how forex traders can incorporate effective profit-taking strategies to maximize their returns while a trend persists:
Similar to stop-loss orders for limiting losses, take-profit orders can be placed to automatically exit a trade when the price reaches a predetermined level of profitability. This helps traders avoid the temptation of greed, a common pitfall that can lead to missed opportunities. By setting take-profit orders beforehand, traders ensure they capture a portion of the gains, even if the trend has further room to run. These profit targets can be established based on technical analysis tools like Fibonacci retracements or price projections, or based on a pre-defined risk-reward ratio that balances potential gains with acceptable risk.
For a more dynamic approach, trailing take-profit orders can be employed. These orders automatically adjust the profit target as the trend moves in your favor. Imagine you enter a long position (buying) in an uptrend. A trailing take-profit order would automatically raise the target price as the price increases, allowing you to progressively lock in profits while still maintaining some exposure to the potential continuation of the trend. This strategy helps balance profit-taking with the opportunity to capture further gains if the trend remains strong.
While take-profit orders automate exits at predetermined levels, it’s crucial to monitor the trend’s strength and broader market conditions for a more comprehensive approach. Momentum indicators like the Relative Strength Index (RSI) or Stochastic Oscillator can provide valuable insights. If these indicators reach overbought territory, it might suggest the trend is losing momentum and a potential reversal could be on the horizon. This can be a signal to consider taking profits, even if your pre-defined take-profit level hasn’t been hit yet.
Staying informed about upcoming news events and their potential implications allows traders to adjust their profit-taking strategies accordingly. Major economic data releases or unexpected geopolitical events can significantly impact currency valuations and disrupt established trends. For instance, if a strong uptrend is fueled by positive economic data for a particular currency, a disappointing data release in the future could trigger a reversal. Being aware of these potential catalysts can help traders lock in profits before the trend weakens.
What is Counter-trend Trading, and What are the Potential Risks and Rewards associated with this approach?
Counter-trend trading, a strategy that goes against the prevailing trend in the forex market, can be a tempting proposition for some traders. It involves capitalizing on short-term price movements that oppose the overall trend direction. While potentially lucrative, counter-trend trading is inherently risky and requires a high level of skill and discipline.
Counter-trend traders look for opportunities to enter positions that exploit temporary pullbacks or retracements within an established trend. They anticipate the market will soon resume its original trend direction, allowing them to exit the trade with a quick profit. This approach often involves utilizing technical analysis tools to identify these short-term reversals, such as support and resistance levels, or momentum indicators that may be signaling overbought or oversold conditions.
The potential rewards of counter-trend trading can be significant. By correctly identifying and capitalizing on short-term countertrends, traders can potentially profit from numerous small wins throughout a trading session. This can be particularly appealing in relatively range-bound markets where strong trends are less frequent.
However, the risks associated with counter-trend trading are substantial. The market doesn’t always respect support and resistance levels, and momentum indicators can generate false signals. If the trader misinterprets a pullback as a reversal or enters the trade too early, they may face significant losses if the trend resumes its original course. Additionally, the frequent entries and exits required for counter-trend trading can incur higher transaction costs, further impacting potential profits.
Counter-trend trading is generally not recommended for beginner forex traders. The complex analysis and precise timing required for successful execution make it a challenging strategy. However, experienced traders with a strong understanding of technical analysis and risk management can potentially incorporate counter-trend strategies into their overall trading toolbox. It’s crucial to maintain a realistic perspective on the risks involved and to only allocate a small portion of your trading capital to counter-trend positions.
How can Technical Indicators be used to identify potential trend reversals or retracements?
Technical indicators are a language spoken by the forex market, offering valuable insights for traders seeking to navigate the ever-changing tides of currency valuations. While they can’t guarantee future price movements, these tools empower traders to identify potential trend reversals or retracements, critical junctures that can significantly impact their trading decisions.
One way to identify potential trend shifts is by studying moving averages. These act as a smoothing filter, ironing out price fluctuations to reveal the underlying trend direction. By analyzing these lines, forex traders can glean valuable clues about potential trend shifts.
Moving averages can signal a trend reversal through crossovers. When a shorter-term moving average (e.g., 50-day) intersects a longer-term moving average (e.g., 200-day), a crossover occurs. A bullish crossover, where the shorter-term average climbs above the longer-term one, suggests a shift from a downtrend to an uptrend. Conversely, a bearish crossover, where the shorter-term average dips below the longer-term one, hints at a potential reversal from uptrend to downtrend.
The slope and direction of the moving average itself can also be informative. A flattening moving average that was previously trending upwards might indicate a loss of momentum in an uptrend, potentially foreshadowing a retracement or even a complete reversal. Conversely, a moving average that starts to angle upwards after a downtrend could suggest a trend reversal to the upside.
Another group of indicators that can be helpful are momentum indicators. These focus on measuring the relative strength or weakness of a price movement, providing clues about potential trend exhaustion. Two such indicators are the Relative Strength Index (RSI) and the Stochastic Oscillator.
The RSI oscillates between 0 and 100, with readings above 70 generally considered overbought and readings below 30 considered oversold. Divergence between the RSI and the price action can be a sign of a potential trend reversal. For instance, if the price keeps making new highs but the RSI starts forming lower highs, it might suggest a weakening uptrend and a possible retracement or reversal. This contradiction indicates that even though the price is rising, the momentum behind the move is fading, potentially signaling a trend shift.
The Stochastic Oscillator works similarly to the RSI. It measures momentum by comparing the closing price to the price range over a specific period. It also has overbought and oversold zones that can signal potential trend reversals. If the Stochastic Oscillator remains in the overbought territory for an extended period even as the price starts to decline, it might suggest a weakening uptrend and a potential reversal. This extended stay in the overbought zone indicates that despite rising prices, the buying pressure is starting to wane, hinting at a possible trend change.
Support and resistance levels, identified by historical price movements, act as zones where the price tends to find temporary buying or selling interest, creating a tug-of-war between buyers and sellers. These levels can offer valuable clues about potential trend reversals.
A price consistently bouncing off a support level in a downtrend could indicate a potential trend reversal to the upside. This repeated buying pressure at the support level suggests that buyers are increasingly interested in the currency, potentially leading to a reversal of the downtrend. Conversely, a price repeatedly rejected at a resistance level in an uptrend suggests a potential retracement or reversal to the downside. The repeated selling pressure at the resistance level indicates that sellers are stepping in and halting the uptrend, potentially leading to a price decline.
It’s crucial to remember that no single indicator is a foolproof signal. The key to effectively identifying potential trend reversals or retracements lies in using a combination of indicators for confirmation. For instance, a bearish crossover on the moving averages alongside an RSI divergence and a price rejection at a resistance level could provide a stronger indication of a potential downtrend reversal compared to relying on any single indicator. By incorporating these signals together, forex traders can paint a more comprehensive picture of the market’s underlying forces and make informed decisions about potential trend shifts.
What are some Risk Management Techniques Crucial for Counter-trend Trading Strategies?
Counter-trend trading, the art of profiting from short-term price movements against the prevailing trend, can be a lucrative strategy for experienced forex traders. However, its inherent volatility demands a robust risk management framework to mitigate potential losses. Here, we explore some crucial risk management techniques specifically suited for counter-trend trading:
The success of counter-trend trading hinges on identifying opportunities to capitalize on temporary pullbacks or retracements within a trend. Therefore, having clear entry criteria is essential. This means basing your entry decisions on technical indicators like support and resistance levels or momentum indicators reaching overbought/oversold zones. By adhering to a defined trading strategy with clear entry criteria, you ensure you’re only entering trades with a high probability of success.
Stop-loss orders are an absolute necessity in counter-trend trading. These automatic orders close your position if the price reaches a predetermined level, limiting your potential losses if the market moves against you. Since counter-trend trades are inherently more likely to experience short-term fluctuations against your position, setting tighter stop-loss orders compared to a trend-following strategy is crucial.
The fast-paced nature of counter-trend trading necessitates a proactive approach to profit-taking. Consider using take-profit orders that automatically exit your trade when a certain level of profitability is reached. This helps you lock in gains before the counter-trend loses momentum and potentially reverses. Additionally, trailing stop-loss orders, which automatically adjust your stop-loss upwards as the price moves in your favor, can help you secure profits while still allowing you to benefit from further upside potential in the counter-trend.
Given the higher risk associated with counter-trend trading, employing smaller position sizes compared to a trend-following strategy is crucial. This ensures that a single losing trade doesn’t wipe out a significant portion of your trading capital. By risking a smaller percentage of your capital on each trade, you maintain the flexibility to weather potential losses and stay in the game for the long haul.
While it’s tempting to concentrate your capital on a single perceived high-probability counter-trend opportunity, diversification is key. Allocate your trading capital across multiple counter-trend trades with different entry and exit points. This approach helps spread your risk and reduces the impact of any single losing trade on your overall portfolio.
The allure of holding onto a losing counter-trend trade in the hope that it will eventually turn profitable can be strong. However, adhering to your pre-defined entry and exit criteria is paramount. Letting emotions cloud your judgment can lead to impulsive decisions that exacerbate losses. Develop the discipline to stick to your trading plan, even when faced with challenging market conditions.
Counter-trend trading is not about predicting the future perfectly. Losses are inevitable. The key is to analyze each losing trade objectively, identify any mistakes made, and adjust your strategy accordingly. View these losses as learning opportunities that help you refine your skills and become a better counter-trend trader.
By incorporating these risk management techniques into your counter-trend trading strategy, you can significantly improve your chances of success in this challenging market arena. Remember, counter-trend trading requires a high level of discipline, a deep understanding of technical analysis, and the ability to manage risk effectively. By employing these strategies and maintaining a measured approach, you can navigate the counter-trend currents of the forex market and potentially capture profitable opportunities.
How can Forex Traders maintain Discipline and Avoid Emotional biases when Trading based on trends?
The allure of profiting from strong trends in the forex market is undeniable. But navigating these trends effectively requires more than just identifying the direction. The emotional rollercoaster inherent in trading can significantly impact your decision-making. Here’s how forex traders can cultivate discipline and avoid emotional biases when trading based on trends:
Building a Strong Foundation: Develop a Trading Plan and Stick to It
A well-defined trading plan acts as your anchor in the sometimes-turbulent waters of the forex market. This plan outlines your entry and exit criteria, risk management parameters, and position sizing strategy. By establishing these rules beforehand, you reduce the urge to make impulsive decisions based on emotions in the heat of the moment. Having a clear plan allows you to approach each trade objectively and systematically.
Before deploying your strategy with real capital, put it through its paces using historical data through a process called backtesting. This helps you identify any weaknesses or areas for improvement in your approach. By refining your strategy based on backtesting results, you gain confidence in its effectiveness. This confidence can be a powerful tool in reducing the anxiety and fear that can lead to emotional trading decisions.
The first step to overcoming emotional biases is acknowledging them. Common biases like fear of missing out (FOMO) or the sunk cost fallacy can cloud judgment and lead to irrational decisions. By recognizing your own tendencies, you can be more vigilant in identifying when emotions are influencing your trading.
Develop a sense of detachment from the outcome of individual trades. Focus on following your trading plan and executing your strategy consistently. Accept that losses are inevitable, and view them as learning opportunities rather than reasons to panic or abandon your strategy entirely. Maintaining emotional control allows you to make rational decisions based on analysis, not fear or greed.
Develop a consistent routine for analyzing markets, placing trades, and monitoring positions. This routine helps you approach trading with a clear head and reduces the stress associated with making decisions on the fly. Having a structured approach fosters discipline and reduces the potential for impulsive actions driven by emotions.
Proper risk management through techniques like stop-loss orders and position sizing helps mitigate potential losses and protects your trading capital. Knowing that your downside risk is limited allows you to approach trades with a calmer mind, reducing the fear of losing significant amounts of money,pen_spark which can often lead to emotional trading decisions.
What are some common psychological pitfalls to be aware of when analyzing and reacting to market trends?
Forex traders navigate a market driven not just by numbers, but by emotions. Here’s how to outsmart your own brain:
- Confirmation Bias: Don’t just seek evidence that confirms your trade idea. Look for contradictions too, to avoid a distorted market view.
- Herd Mentality: Don’t blindly follow the crowd. Analyze trends yourself before jumping in. Popularity doesn’t guarantee success.
- Fear and Greed: Fear of missing out (FOMO) leads to hasty entries, while greed makes you hold onto losing positions. Develop a trading plan and stick to it to avoid these emotional traps.
- Anchoring Bias: Don’t cling to initial assumptions. The market is dynamic. Adapt your strategy as conditions change.
- Overconfidence: Winning streaks can make you reckless.pen_spark Don’t let it inflate your ego. Always practice good risk management.
How can developing a Strong Trading Plan help Forex Traders stay focused and disciplined during Trending Markets?
A trading plan is your anchor in volatile trending markets. It outlines entry/exit points so you trade objectively, not emotionally. Backtesting your strategy beforehand builds confidence. The plan also keeps you detached from emotions by incorporating risk management and promotes discipline through a set routine. With a plan, you can navigate trends with focus and make well-considered decisions.
How does Trend Analysis compare to other Technical Analysis approaches used in Forex Trading?
Trend analysis is a core tool in forex trading, but it’s just one piece of the puzzle. Support/resistance helps pinpoint entry/exit points within trends, while moving averages confirm trends and identify potential reversals. Chart patterns complement trend analysis by offering signals for trend continuations or entry/exit points aligned with the trend. Finally, volume analysis, which goes beyond just price movements, can indicate the strength of a trend and potential turning points. By combining trend analysis with these other technical tools, forex traders gain a well-rounded view of the market, allowing them to make informed decisions about trends and their trading strategies.
What resources are available to Forex Traders to Improve their Trend Identification and Analysis Skills?
Forex traders have a wealth of resources to sharpen their trend-spotting skills. Educational platforms from forex brokers and online academies offer video tutorials, courses, and structured learning. Technical analysis tools on trading platforms and third-party software allow visualization of price movements, indicator application, and backtesting of strategies. Financial news websites, publications, and social media groups provide expert analysis, outlooks on emerging trends, and discussions with other traders. Remember, consistent practice analyzing charts, testing indicators, and learning from experience are key to becoming a skilled trend identifier.
Support Levels: Understanding, Identifying, and Trading Considerations
25 May 2024[…] can even signal a continuation of the trend, offering potential trading opportunities. As the trend progresses, support levels themselves can shift up in uptrends or down in downtrends. Ranging […]