
Retracements are temporary price movements that pull back against the prevailing trend. Imagine an uptrend – a retracement signifies a brief price dip before the uptrend likely resumes its upward climb. Conversely, in a downtrends, a retracement is a temporary price surge before the downtrend potentially continues its downward path. These retracements offer a double-edged sword for forex traders.
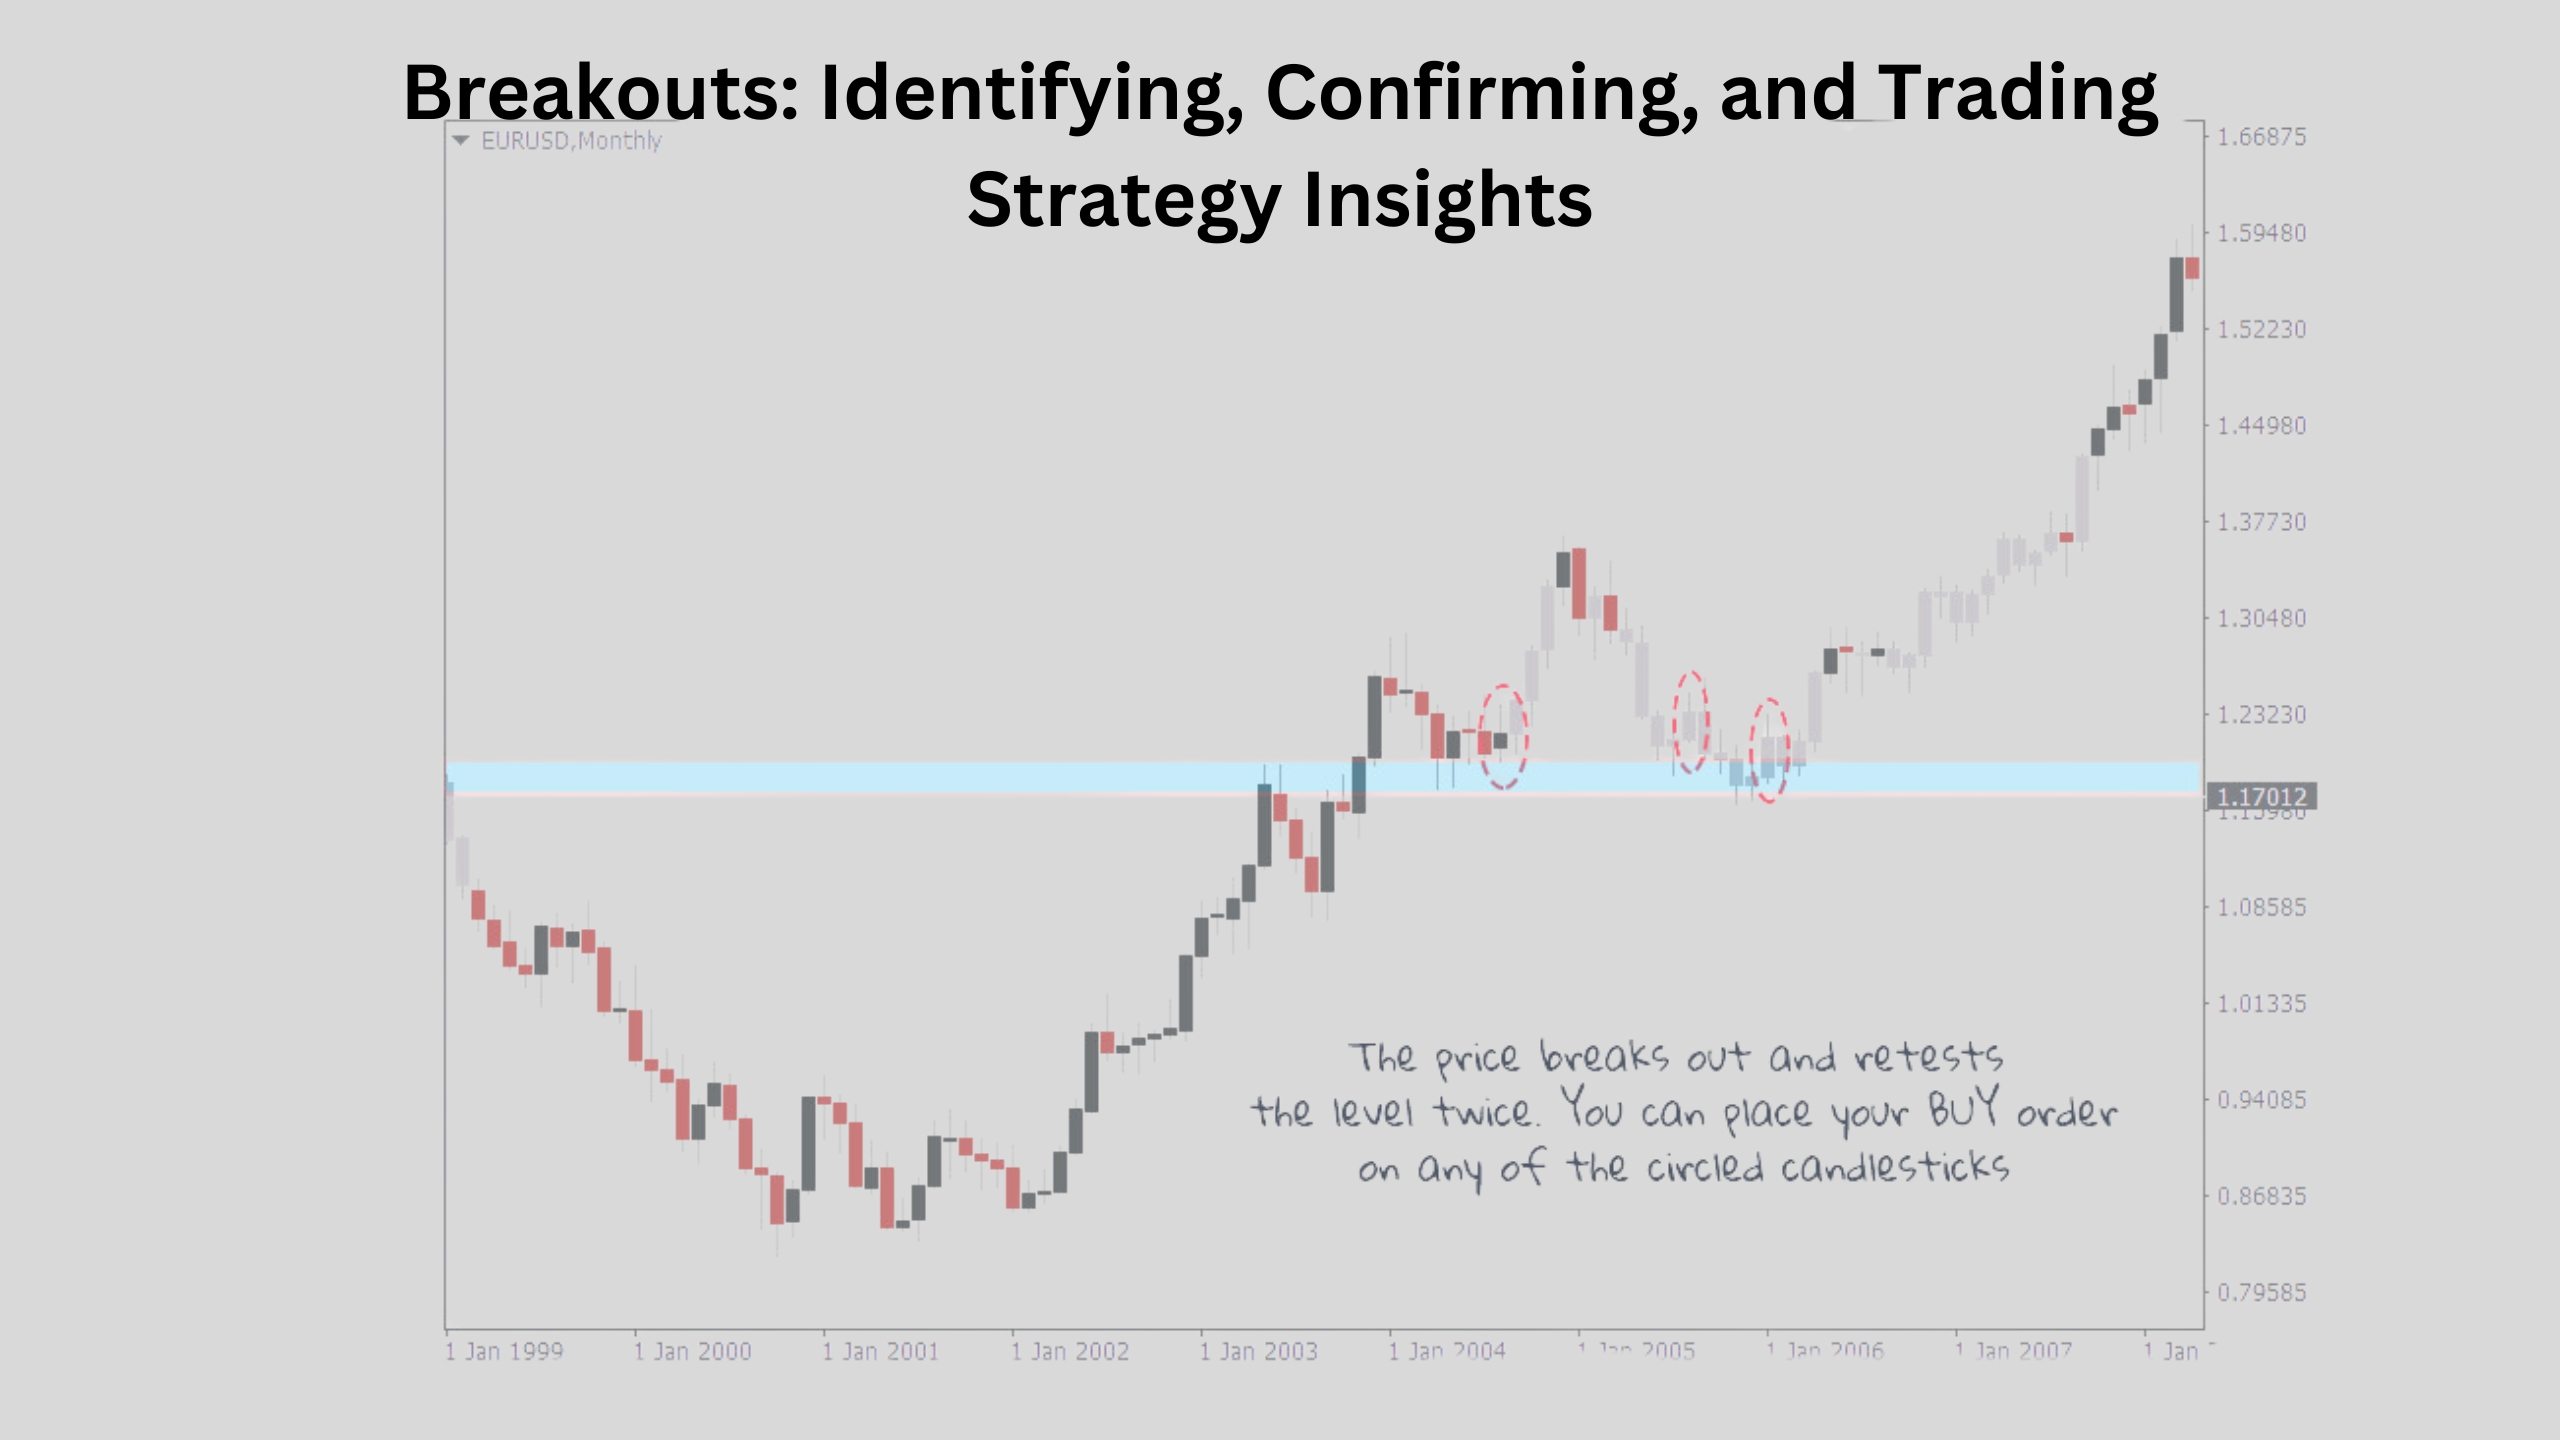
On the one hand, retracements present valuable opportunities. They can provide re-entry points for traders who missed the initial trend move. For instance, during an uptrend retracement, traders who couldn’t enter at the beginning might see an attractive opportunity to buy at a lower price point before the uptrend resumes its momentum. Additionally, retracements can act as confirmation tools for the underlying trend. If the price retraces to a specific level (like a previous support level in an uptrend) but finds strong buying pressure and resumes the uptrend, it strengthens the overall trend’s validity.
However, retracements can also be deceptive. False breakouts can occur, where the price appears to break below support in an uptrend (or above resistance in a downtrend) but then quickly reverses back into the prevailing trend. This can lead to missed opportunities or losing trades for traders who misinterpret the retracement as a trend reversal.
Table of Contents
What are Retracements (pullbacks) in Forex Trading, and how do they relate to trends?
The foreign exchange market, or forex for short, is a dynamic environment where prices constantly fluctuate. While trends, both uptrends and downtrends, can offer significant profit potential for traders, these trends are rarely linear. This is where retracements, also known as pullbacks, come into play.
What are Retracements?
Imagine an uptrend in a currency pair. The price steadily climbs, reflecting increasing demand for one currency relative to the other. However, the upward climb isn’t always a smooth journey. The price will often experience temporary pauses or even brief reversals, dipping back down before resuming its upward trajectory. These temporary price movements against the prevailing trend are what we call retracements.
The Role of Retracements in Trend Analysis
Retracements play a crucial role in trend analysis for forex traders. By understanding how retracements relate to trends, traders can gain valuable insights and make informed trading decisions. Here’s how:
- Identifying Trend Continuation: Retracements don’t necessarily signal the end of a trend. In fact, they can often act as a healthy correction within a trend. A strong trend will typically see the price retrace only a portion of its previous move before resuming its direction. By studying the depth and duration of retracements, traders can assess the underlying strength of the trend and potentially identify opportunities to re-enter the trend at a more favorable price point.
- Confirmation of Support and Resistance: Retracements can also help confirm support and resistance levels. Support levels are price zones where buying pressure typically increases, preventing the price from falling further. Conversely, resistance levels represent areas where selling pressure tends to intensify, hindering further price advances. When a retracement finds support at a previously established level and bounces back, it reinforces the validity of that support zone. Similarly, a retracement that stalls at a resistance level before reversing lower strengthens the resistance zone’s significance.
- Identifying False Breakouts: Not all price movements against the trend are genuine retracements. False breakouts can occur, where the price appears to break below support in an uptrend or above resistance in a downtrend, but then quickly reverses back into the prevailing trend. Analyzing retracements alongside other technical indicators can help forex traders distinguish between genuine pullbacks and false breakouts, preventing them from entering trades based on misleading signals.
How do Retracements help Forex Traders Identify the Strength and Continuation of Trends?
While trends offer exciting opportunities in forex trading, they’re not always a smooth ride. Retracements, those temporary pullbacks against the trend, become a forex trader’s ally in deciphering trend strength and continuation. Here’s how:
Imagine a strong uptrend. A shallow retracement, where the price dips only slightly before resuming its upward climb, suggests the uptrend is robust. Limited selling pressure allows the uptrend to quickly regain momentum. Conversely, a deeper or longer-lasting retracement might indicate a weakening trend, as selling pressure becomes more prominent.
The price action at support and resistance levels during retracements provides further clues. If a retracement in an uptrend finds support at a previous support level and bounces back, it reinforces the uptrend’s strength. Buyers are readily available at that price point, preventing a deeper decline. Similarly, a retracement in a downtrend that stalls at a resistance level before reversing lower strengthens the downtrend. Selling pressure intensifies at that resistance zone, limiting any potential price advances.
Are there Different Types of Retracements Relevant to Forex Analysis?
Yes, there are two main types of retracements relevant to forex analysis:
- Fibonacci Retracements: This popular approach utilizes Fibonacci ratios (like 38.2%, 50.0%, and 61.8%) to identify potential retracement levels following a strong price move. The price might retrace back to one of these Fibonacci levels before resuming the trend.
- Price Action Retracements: This method focuses on the price action itself during a retracement. Traders look for specific candlestick patterns or price movements (like support and resistance levels) to gauge the potential depth and direction of the retracement.
Both Fibonacci retracements and price action retracements offer valuable tools for forex traders to analyze trends and identify potential entry and exit points.
Which Technical Indicators can help Identify Potential Retracement Zones in Forex Charts?
Unearthing potential retracement zones in forex charts is crucial for identifying entry and exit points within trends. Here’s a toolbox of technical indicators that empower forex traders in this quest:
- The Fibonacci Magic: The Fibonacci retracement tool is a popular favorite. It overlays a series of horizontal lines (like 38.2%, 50.0%, and 61.8%) on a price move, highlighting potential zones where the price might retrace before resuming the trend. Imagine a strong uptrend – a retracement to the 38.2% Fibonacci level could be a potential buying opportunity if the uptrend is likely to continue.
- Guardians of Support and Resistance: Support and resistance levels, represented by horizontal lines on the chart, act as battlegrounds in the forex market. Support zones indicate areas where buying pressure typically gathers strength, preventing the price from falling further (in uptrends). Conversely, resistance zones represent areas where selling pressure intensifies, hindering price advances (in downtrends). Retracements often find support at previously established support levels, or encounter resistance at previous resistance levels, offering valuable clues for potential retracement depth and direction.
- The Moving Average Whisperer: Moving averages smooth out price fluctuations, revealing the underlying trend direction. Retracements might find temporary pauses near the moving average line, especially if the moving average is aligned with the prevailing trend. Imagine an uptrend with a rising 50-day moving average. A retracement that finds support near the 50-day moving average could signal a potential buying opportunity within the uptrend.
- The RSI’s Momentum Clues: The Relative Strength Index (RSI) is a momentum indicator that measures overbought or oversold conditions. During an uptrend, a retracement might coincide with the RSI reaching overbought territory (above 70). This suggests a potential pause before the uptrend resumes. Conversely, in a downtrend, a retracement might align with the RSI dipping into oversold territory (below 30), indicating a possible bounce before the downtrend continues.
How do Fibonacci Retracement Levels play a Role in Analyzing Retracements?
Fibonacci retracements offer a unique lens for analyzing retracements in forex trading. Derived from a mathematical sequence, these ratios (like 38.2%, 50.0%, and 61.8%) are overlaid on a price move, highlighting potential zones where the price might take a breather or even reverse before continuing the prevailing trend. Imagine a strong uptrend – a retracement to the 38.2% Fibonacci level could indicate a buying opportunity if the uptrend is likely to resume after a temporary pause.
There’s a layer of psychology woven into this concept as well. The theory suggests that these Fibonacci ratios represent levels where market participants tend to place orders, potentially creating support or resistance around those retracement zones. This can be a self-fulfilling prophecy to some extent, as more traders become aware of these levels and factor them into their decisions.
How can Forex Traders confirm the validity of a Retracement within a Trend?
Confirming the legitimacy of a retracement within a forex trend is crucial for capitalizing on opportunities and avoiding costly mistakes. Price action analysis forms the foundation. Look for shallow retracements in strong trends, where the price dips only slightly before resuming its direction. This suggests the underlying trend remains dominant. Conversely, deeper or longer retracements might indicate a weakening trend.
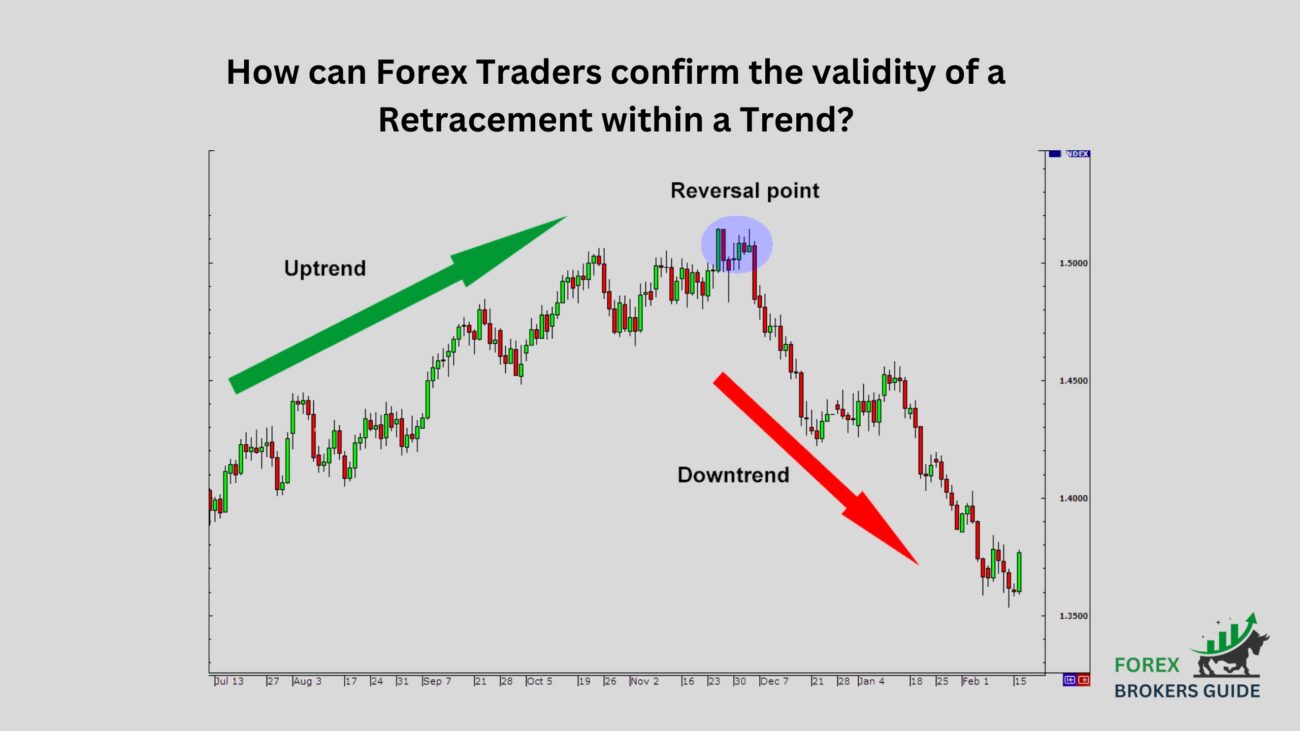
Secondly, support and resistance levels offer valuable clues. If a retracement in an uptrend finds support at a previously established level, or a retracement in a downtrend stalls at a resistance level before reversing, it strengthens the trend’s validity. This price action suggests the trend is holding firm.
Technical indicators can add further confirmation layers. Fibonacci retracements provide potential retracement zones based on historical patterns. If a retracement finds support around a Fibonacci level and aligns with supportive price action, it strengthens the case for a valid retracement within the trend. Similarly, moving averages and momentum indicators like RSI can offer additional confirmation when their signals coincide with supportive price action during a retracement.
Remember, confirmation is key, but not a guarantee. False breakouts can still occur, highlighting the importance of stop-loss orders for risk management. Furthermore, volatility can impact retracement behavior. Be mindful of prevailing market conditions to better interpret retracement depth and duration.
How can Forex Traders use Retracements to Identify Potential Entry Points for Trend-following Trades?
For forex traders who thrive on following trends, retracements can be a game-changer. These temporary pullbacks within a trend present a valuable opportunity to enter trades at potentially more favorable prices. Imagine a strong uptrend – a retracement offers a chance to buy at a lower price point compared to the initial surge. This is particularly attractive for traders who missed the initial price jump but still believe the uptrend has room to run.
By analyzing the retracement’s depth and duration alongside price action at support zones, forex traders can gauge the potential for the trend to resume after the pullback. A shallow retracement that finds support at a previously established level suggests the underlying uptrend remains dominant. This creates a potential entry point for long positions (buying) with a more favorable price than the initial trend move. However, confirmation is crucial. If the retracement bounces back from the support level, it strengthens the case for the uptrend’s continuation. This confluence of price action and trend confirmation allows traders to enter with greater confidence.
What Risk Management techniques are crucial for Trading Retracements in Forex?
Here are two crucial risk management techniques for trading retracements in forex:
- Stop-Loss Orders: These pre-determined orders automatically close your position if the price moves against you beyond a certain level. This helps limit potential losses, especially during volatile retracements that might break below support or above resistance, unexpectedly reversing the trend.
- Position Sizing: This refers to the amount of capital you risk on a single trade. A common strategy is to risk only a small percentage (e.g., 1-2%) of your account balance per trade. This helps ensure that even a losing trade on a retracement doesn’t cause significant damage to your overall account equity.
How can Forex Traders set realistic Profit targets when Trading Retracements?
The allure of substantial profits can be a siren song for forex traders, particularly when capitalizing on retracements within trends. However, setting realistic profit targets is paramount for sustainable success. Here’s how forex traders can navigate this crucial aspect:
Understanding Risk-Reward Ratio: The foundation lies in understanding the risk-reward ratio. This ratio compares the potential profit on a trade to the potential loss. For instance, if a trader risks 1% of their account balance on a trade and aims for a 2% profit, they have a 2:1 risk-reward ratio.
Aligning Targets with Retracement Depth: Since retracements are temporary pullbacks, profit targets should be realistic in relation to the retracement depth. For example, in a shallow retracement within a strong trend, aiming for a massive profit might be unrealistic. The price might simply not have enough room to move before resuming the trend.
Technical Levels as Guideposts: Technical levels like support and resistance can serve as guideposts for profit targets. In an uptrend following a retracement, a profit target could be set near a previous resistance level that the price might struggle to surpass before encountering selling pressure. Conversely, in a downtrend, a profit target could be set near a support level that might act as a buying zone, potentially halting the price decline.
Volatility Matters: Volatility is a key factor. During periods of high volatility, retracements can be deeper and more erratic. Profit targets should be adjusted accordingly, potentially aiming for smaller gains in exchange for managing the risk of larger price swings.
Discipline is Key: Sticking to predetermined profit targets is crucial. While emotions might tempt you to hold onto a trade in hopes of further gains, exiting at your target protects your profits and allows you to re-evaluate potential re-entry points if the trend continues.
How can Specific Price Action Patterns around Retracements Strengthen Trade Signals?
Specific price action patterns around retracements can strengthen trade signals for forex traders in two key ways:
- Confirmation of Trend Direction: Certain candlestick patterns appearing during a retracement can reinforce the underlying trend. For example, during an uptrend retracement, a bullish engulfing pattern (where a bullish candle completely engulfs the body of the preceding bearish candle) suggests strong buying pressure and potential trend continuation after the retracement.
- Improved Entry and Exit Points: Price action patterns can also provide more precise entry and exit points within a retracement. For instance, a pin bar forming at a support level during an uptrend retracement might indicate a potential reversal point for buying, offering a more targeted entry than simply relying on the support level itself.
How does Volatility Impact the Depth and Duration of Retracements?
Volatility throws a curveball at retracement analysis in forex trading. During periods of high volatility, retracements tend to be deeper and more erratic. Imagine a strong uptrend – a retracement in a volatile market might pull back much further from the uptrend line compared to a low volatility scenario. This can be nerve-wracking for traders, as the larger price swings create uncertainty about whether the uptrend will resume after such a deep pullback.
On the other hand, low volatility environments often see shallower retracements. The price movements are more subdued, with retracements carving out smaller dips before the trend picks up again. While this might seem ideal for entering trades closer to the trend line, low volatility can also lead to choppy price action, making it trickier to identify and confirm retracements with confidence.
How can Forex Traders effectively combine Retracements with other Technical Indicators for Trading?
Retracements, those temporary dips within trends, offer valuable clues for forex traders. But to truly harness their power, forex traders should leverage the synergy between retracements and other technical indicators. This combined approach strengthens trade signals and ultimately leads to more informed decisions.
Imagine this: a retracement in an uptrend finds support at a key level while a momentum indicator like the RSI simultaneously signals that the market might be overbought. This confluence of retracement, price action (support), and technical indicator (RSI) strengthens the case for a potential buying opportunity within the uptrend.
The beauty of this combined approach extends beyond simple confirmation. Certain technical indicators can also help refine entry and exit points within retracements. For example, a retracement that aligns with a Fibonacci retracement level (like 38.2%) might also coincide with overbought territory on the RSI. This suggests a potential short-term reversal point within the retracement, offering a more precise entry for a short trade (selling) before the uptrend resumes.
What are the Limitations of Relying Solely on Retracements for Trading Decisions?
While retracements offer valuable insights for forex traders, basing trading decisions solely on them can be a recipe for missed opportunities or even losses. Here’s why it’s crucial to understand their limitations:
- False Signals and Missed Entries: Retracements aren’t guaranteed reversal points. The price might breach support or resistance levels during a retracement, leading to false signals. For instance, a trader relying solely on a retracement to enter a long position (buying) at a support level might miss out if the price breaks below that level, signaling a potential downtrend instead.
- Shallow or Erratic Retracements: Volatility plays a significant role. In high volatility environments, retracements can be deeper and more erratic, making it challenging to identify clear entry and exit points. Conversely, low volatility periods might see shallow retracements, offering limited opportunities for entry near the prevailing trend.
- Lack of Confirmation: Relying solely on retracements ignores other crucial aspects of technical analysis. Confirmation from price action patterns, technical indicators, or fundamental factors is essential before entering a trade. For example, a retracement that doesn’t find support at a key level alongside a bearish RSI signal might suggest a weaker uptrend, highlighting the need for caution before entering a long position based solely on the retracement.
- Subjectivity in Interpretation: There’s an element of subjectivity in interpreting retracement depth and duration. What one trader perceives as a shallow retracement another might view as deep. This subjectivity can lead to inconsistent trading decisions, especially for beginners.
How can Forex Traders differentiate between Retracements and Potential Trend Reversals (false breakouts)?
Differentiating retracements from potential trend reversals (false breakouts) in forex requires a multi-pronged approach:
- Depth and Duration: Retracements are typically shallower and shorter-lived than trend reversals. A strong trend will likely exhibit a shallow retracement before resuming its direction. Conversely, a deeper or longer-lasting pullback might indicate a weakening trend and potential reversal.
- Price Action at Support/Resistance: Retracements often find support at previously established support levels (in uptrends) or encounter resistance at resistance levels (in downtrends) before reversing. False breakouts might pierce these levels but then struggle to sustain the break, with the price quickly reversing back towards the trend.
- Confirmation from Indicators: Technical indicators can offer additional clues. Momentum indicators like RSI might show limited movement during retracements, while significant fluctuations during a retracement could suggest a potential reversal.
- Volatility Matters: Consider prevailing market volatility. Deep retracements might be more common in high volatility environments, while false breakouts can occur more frequently during low volatility periods due to choppy price action.
How can Forex Traders incorporate Retracements into a comprehensive Trend-following Strategy?
For trend-following forex traders, retracements aren’t roadblocks, but rather opportunities. By incorporating retracements into their strategy, they can identify high-probability entry points aligned with the prevailing trend. The key lies in looking for shallow retracements relative to the overall trend, suggesting the underlying trend remains strong. Confirmation from price action, like a retracement finding support in an uptrend, bolsters the case for a potential buy. Furthermore, technical indicators like momentum oscillators aligning with a bounce during a retracement add another layer of confidence.
However, navigating retracements requires discipline. Always employ stop-loss orders to manage risk in case the retracement breaks the trend. Don’t chase every pullback – focus on well-defined trends with high-probability entry points identified through a combination of retracement depth, confirmation signals, and proper risk management. Remember, consistent gains built on a sound strategy are preferable to chasing unrealistic profits on every retracement. By mastering the art of integrating retracements, trend-following forex traders can position themselves to capitalize on potential trend continuations and navigate the dynamic world of forex with greater success.