
Imagine walking into a store without any idea how many people are there or what they’re looking to buy. That can be a confusing way to shop! The forex market can feel similar, especially during busy times. Luckily, forex traders have a special tool called market depth to help them see what’s going on.
Market depth, also known as depth of market (DOM), is basically a real-time picture of how many buy and sell orders there are at different prices for a particular currency pair. It’s like seeing all the shoppers grouped around different sale signs. By understanding market depth, traders can tell how easy it will be to buy or sell a currency (liquidity), where prices might bounce off support or resistance, and even what other traders are thinking (sentiment). This information helps them make smarter choices, find good trading opportunities, and navigate the sometimes-tricky forex market with more confidence.
What is Market Depth in Forex Trading, and how does it differ from liquidity?
Market depth, also known as depth of market (DOM), is a real-time snapshot of the buy and sell orders placed for a specific currency pair at various price levels. Imagine it as a detailed window into the forex market, revealing the concentration of potential buyers and sellers at different price points. This information goes beyond simply knowing there are buyers and sellers; it tells you exactly how many orders are waiting at each price level.

How Market Depth Differs from Liquidity
Market depth is intricately linked to, but distinct from, liquidity. Here’s how they differ:
- Market Depth: Provides a granular view of the quantity of buy and sell orders at specific price levels. It tells you how many traders are willing to buy or sell at a particular price.
- Liquidity: Refers to the ease with which a currency pair can be bought or sold at a stable price. It’s a broader concept that takes into account not just the number of orders but also the order sizes and the speed at which orders are filled.
Think of it this way: Market depth is like looking at a crowded grocery store aisle. You can see a lot of people (orders), but you don’t necessarily know if they’ll all get what they came for (liquidity). A deep market depth, with a high concentration of orders at each price level, usually indicates good liquidity. However, it’s important to consider the order sizes as well. A large number of small orders might not translate to the same level of liquidity as a smaller number of larger orders.
By understanding both market depth and liquidity, forex traders gain valuable insights:
- Potential for Price Movement: High market depth at a particular price level can indicate strong support or resistance, as there are many orders waiting to buy or sell at that price.
- Order Execution Speed: Deeper markets generally allow for faster order execution, as there are more potential counterparties for your trade.
- Trader Sentiment: Market depth can offer clues about trader sentiment. A large imbalance of buy or sell orders at a particular price level might suggest a potential trend in the making.
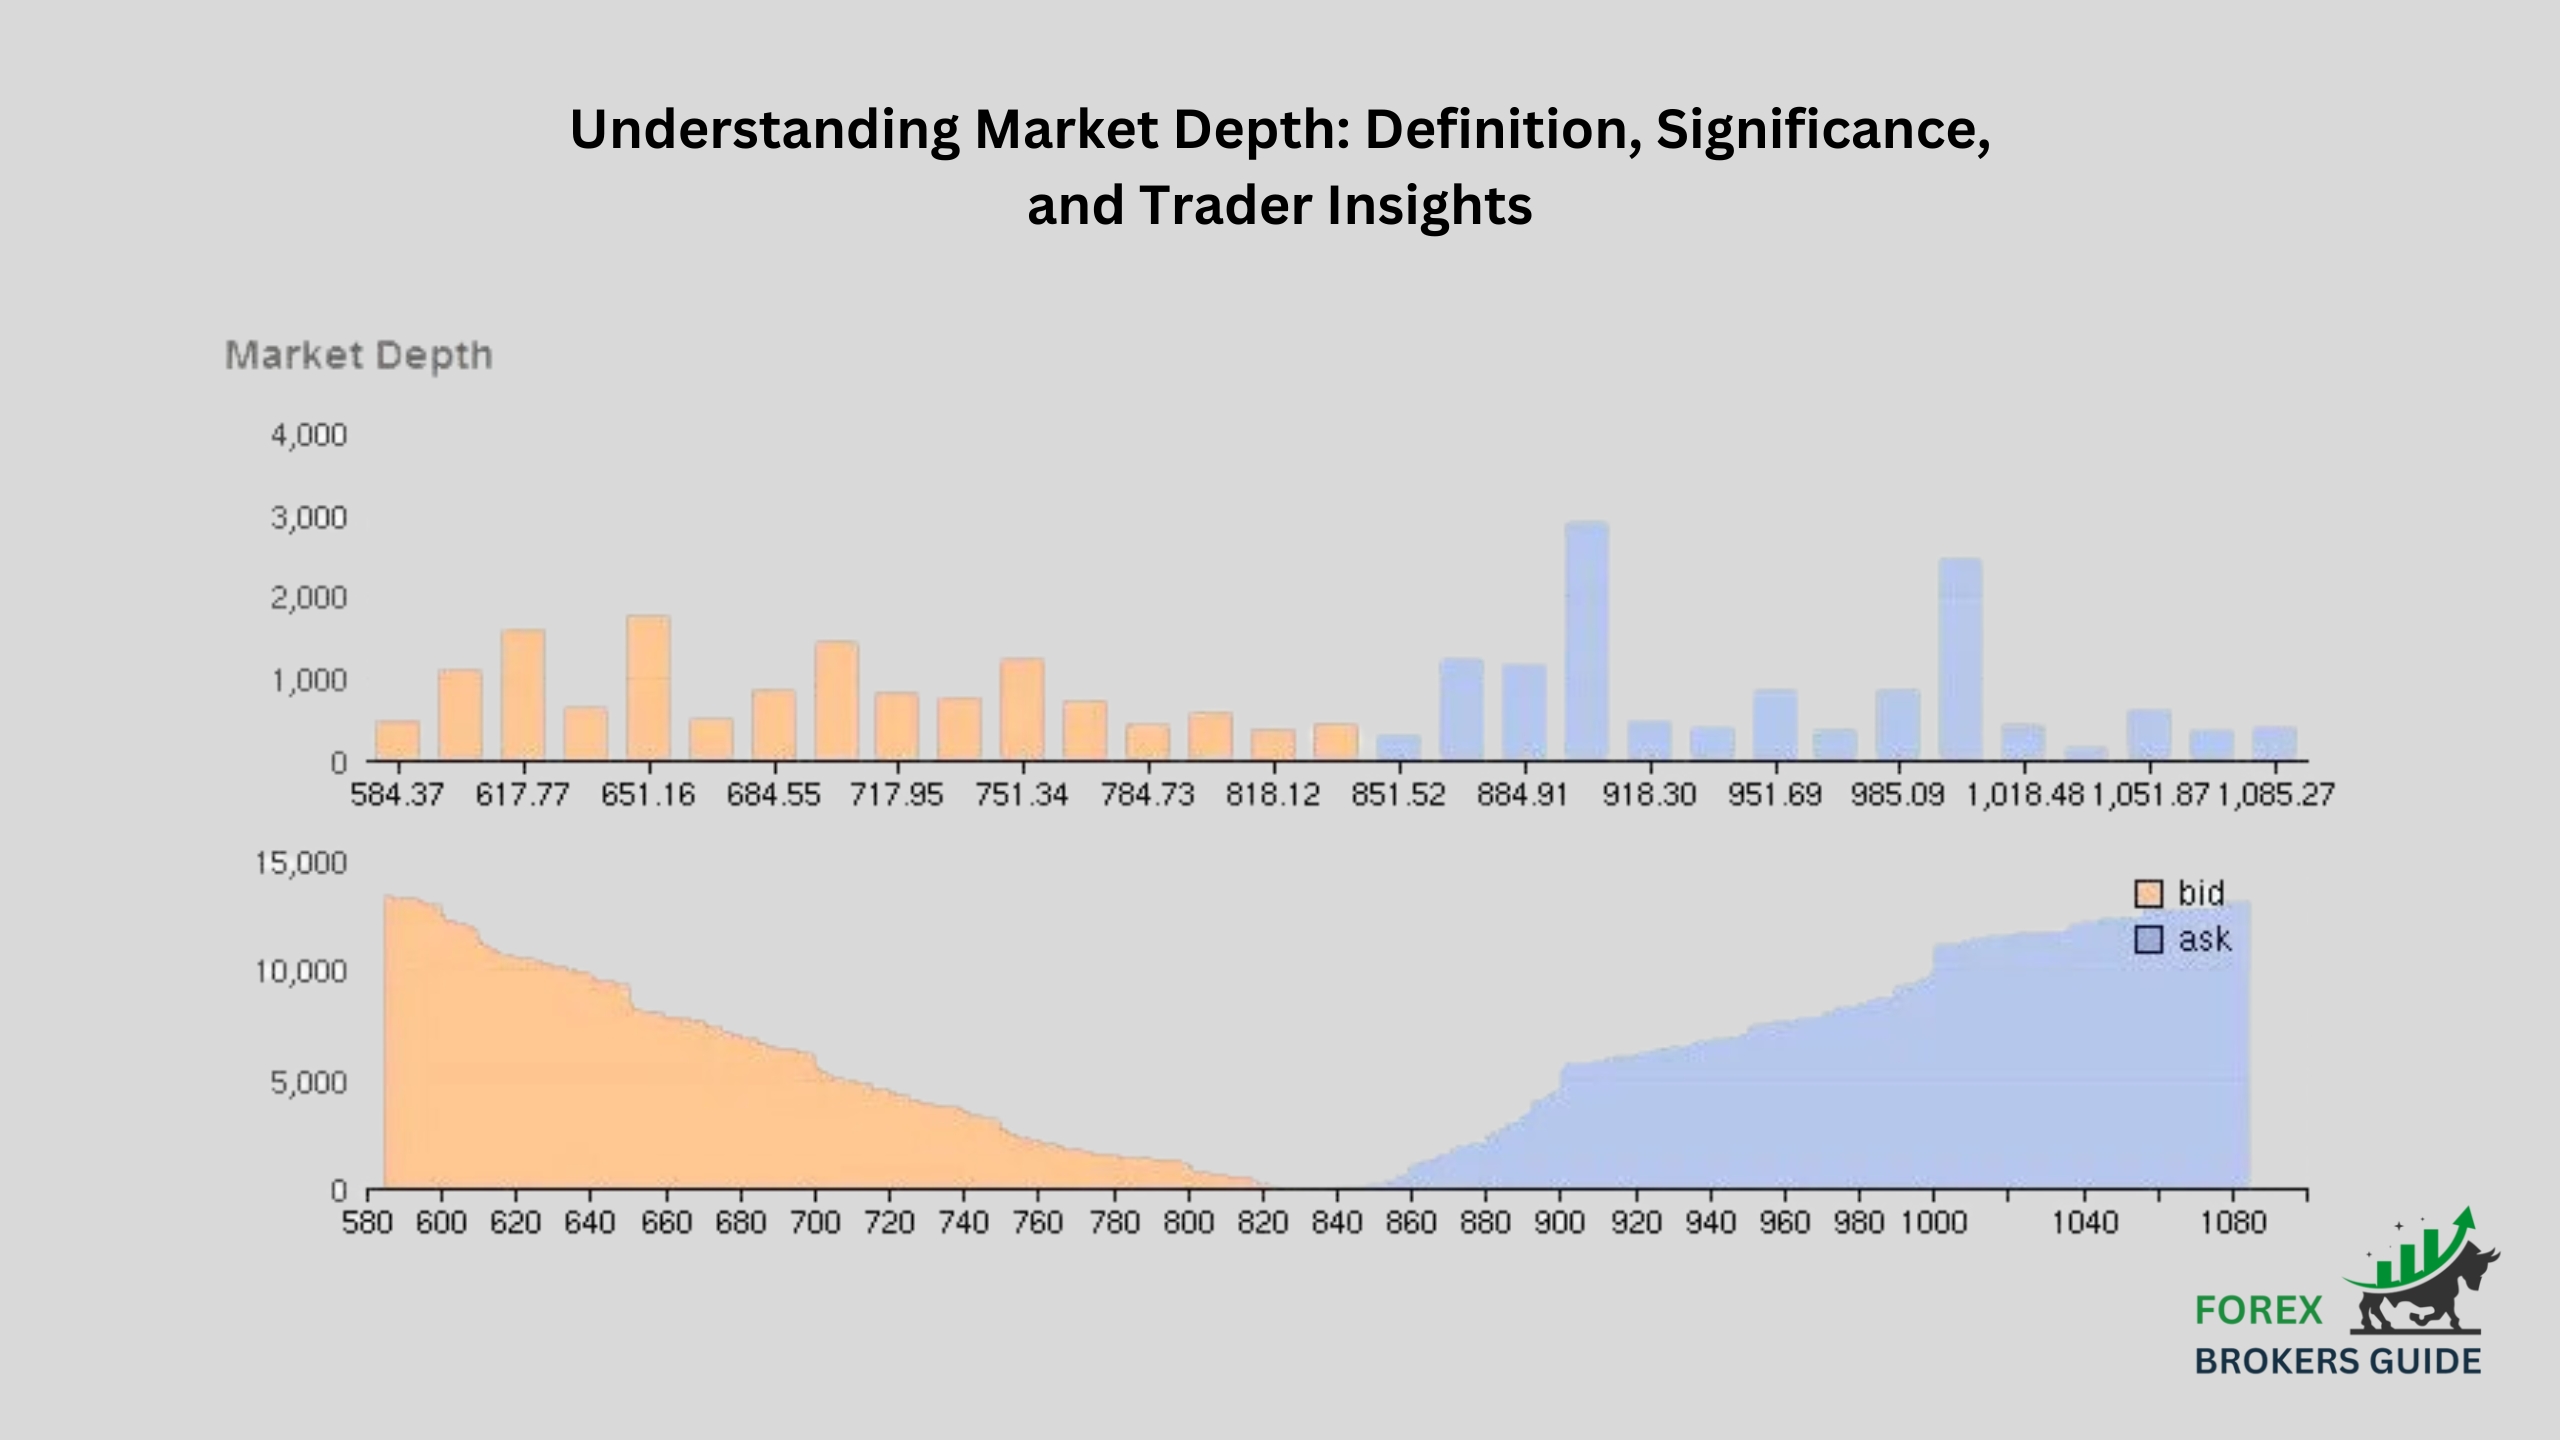
How is Market Depth typically visualized in Forex Trading Platforms?
The DOM display provides a clear visual representation of this data, allowing traders to quickly grasp key market dynamics. Here’s a breakdown of the typical elements you’ll encounter:
- Price Levels and Order Bars: The vertical axis displays the ask (selling) prices at the top and the bid (buying) prices below, forming a price ladder. The spacing between each price level reflects the minimum price increment (pip) for the currency pair. Each price level has two horizontal bars representing buy and sell orders. The length of each bar signifies the total volume of orders at that specific price. A longer bar indicates a higher concentration of orders waiting to buy or sell at that particular price point.
- Colors and Order Volume: Many platforms use color coding to differentiate between buy and sell orders. Green bars typically represent buy orders, while red bars represent sell orders. This color distinction allows for a quick visual identification of the dominant order flow at each price level. Many platforms take it a step further by displaying the numerical value of the order volume within each bar. This provides a more precise understanding of the exact number of orders queued up at each price point.
- Total Volume and Additional Features: Some platforms might also display the total buy and sell volume at the bottom of the DOM. This offers a quick glimpse into the overall market activity for the currency pair. Beyond these core elements, some advanced platforms offer additional features within the Market Depth display, such as heatmaps and order book details. Heatmaps use color-coded visualizations to highlight areas of high order concentration, while order book details allow traders to see the distribution of order sizes within a specific price level.
What are the Key Components of an Order book, and how do they contribute to understanding market depth?
The order book is essentially a real-time record of all outstanding buy and sell orders for a specific currency pair at various price levels. It can be dissected into two key components:
- Bid Side: This section showcases all the buy orders placed by traders. It reflects the maximum price they are willing to pay for the base currency in the pair. A high concentration of bids at a particular price level suggests strong demand for that currency.
- Ask Side: This section displays all the sell orders placed by traders. It indicates the minimum price they are willing to accept for the base currency in the pair. A high concentration of asks at a specific price level suggests strong selling pressure for that currency.
By analyzing these components, traders gain valuable insights into market depth:
- Order Volume: The quantity of buy and sell orders at each price level reveals the level of interest at that price. A higher volume on either side indicates a more concentrated market, potentially leading to smoother order execution.
- Price Levels: The distribution of orders across different price levels helps identify potential support and resistance zones. Support levels are areas with a high concentration of buy orders, suggesting the price might bounce back if it falls to that level. Conversely, resistance levels are areas with a high concentration of sell orders, suggesting the price might struggle to break through that level.
- Order Imbalance: A significant difference between the buy and sell volume at a particular price level can indicate a potential trend in the making. A surplus of buy orders suggests a potential price increase, while a surplus of sell orders suggests a potential price decrease.
How can analyzing Market Depth help Forex Traders gauge market sentiment?
Market depth analysis offers a window into the underlying psychology of the market through several key aspects. A significant difference between buy and sell orders at a particular price level can be a strong indicator of sentiment. A surplus of buy orders suggests bullish sentiment, where traders are optimistic about the base currency’s future value and are willing to buy at that price. Conversely, a surplus of sell orders suggests bearish sentiment, where traders are pessimistic about the base currency’s future value and are eager to sell.
The way orders accumulate and disappear within the order book can also reveal sentiment shifts. For example, if buy orders are quickly snapped up at a particular price level, it suggests strong underlying demand and potentially bullish sentiment. Conversely, if sell orders are readily filled, it might indicate a weakening buying interest and a shift towards bearish sentiment.
Monitoring changes in order volume at different price levels can also provide clues about sentiment. A sudden increase in buy volume at a support level might suggest renewed buying interest and a potential reversal of a downtrend. On the other hand, a sharp decline in buy volume near a resistance level could indicate fading bullish sentiment and a possible price pullback.
What insights can Market Depth provide on potential Support and Resistance levels?
Understanding how market depth empowers forex traders to identify potential support and resistance levels requires examining the distribution of buy and sell orders within the order book. Areas with a high concentration of buy orders, typically clustered around previous lows, suggest strong buying interest at those price points. This concentration acts as a potential support level. Imagine a wall of buy orders; a wave of sell orders would need to be absorbed before the price can fall further. Conversely, areas with a high concentration of sell orders, often found near previous highs, indicate strong selling pressure at those price points. This concentration acts as a potential resistance level, like a ceiling that a surge of buy orders would need to overcome before the price can rise further.
Market depth analysis goes beyond just order concentration. As discussed earlier, a significant difference between buy and sell orders at a particular price level can be indicative of sentiment. A surplus of buy orders near a potential support level reinforces its strength, as it suggests a stronger willingness to buy at that price, further bolstering the support zone. Conversely, a surplus of sell orders near a potential resistance level reinforces its strength, as it suggests a stronger willingness to sell at that price, solidifying the resistance zone.
The behavior of orders within the order book can also offer clues about potential support and resistance. If buy orders are consistently placed and quickly filled near a support level, it suggests ongoing buying interest and a potentially strong support zone. Conversely, if sell orders are readily placed and filled near a resistance level, it suggests ongoing selling pressure and a potentially strong resistance zone. Additionally, observing how orders accumulate or disappear at these levels can be informative. A sudden influx of buy orders at a support level or a drying up of sell orders at a resistance level could signal a potential reversal of the current trend, offering valuable insights for trade entry and exit decisions.
How can understanding Order Book dynamics inform Entry and Exit points for trades?
By analyzing how buy and sell orders accumulate and interact within the order book, traders can gain valuable insights to inform their entry and exit decisions.
Order book dynamics offer valuable clues for identifying potential entry points for both long and short trades. Support zones, marked by a high concentration of buy orders, can be good entry points for long trades (buying the base currency). When the price approaches a support zone, and buy orders are being filled consistently, it suggests underlying buying interest. This can be a good time to enter a long trade, anticipating a potential bounce off the support level.
Conversely, resistance levels marked by a high concentration of sell orders can be potential entry points for short trades (selling the base currency). If the price breaks through a resistance level with a surge in buy orders being filled, it suggests a potential shift in sentiment and a possible price increase. Entering a short trade just after such a breakout can allow traders to capitalize on the price moving downwards.
Beyond identifying entry points, order book dynamics also play a crucial role in crafting exit strategies. A key concept to watch for is a thinning order book near support or resistance levels. This occurs when the concentration of orders on one side (buy or sell) starts to diminish. This can indicate a weakening of support or resistance, suggesting a potential trend reversal.
If a trader is already in a long trade near a support level that’s thinning out, it might be a good time to exit and lock in profits before the price breaks lower. Conversely, a thinning order book near resistance could signal a weakening resistance level, prompting a trader in a short trade to consider exiting before the price rallies higher.
Significant changes in the buy-sell order imbalance at a particular price level can also indicate potential entry or exit points. If a support level sees a sudden surge in sell orders, overwhelming the existing buy orders, it suggests a potential breakdown of support. This could be a good time to exit a long trade or even consider entering a short trade to capitalize on the price decline.
Conversely, a resistance level that sees a sudden influx of buy orders, overcoming the sell orders, could signal a potential breakout. This could prompt traders in short positions to exit and potentially consider entering long trades to capture the price increase.
How can Forex Traders interpret the Volume of Buy and Sell Orders at different Price Levels?
order book analysis reveals the bid and ask prices at various levels, the volume of buy and sell orders at each level adds another layer of complexity and valuable information. Here’s how forex traders can interpret the volume of buy and sell orders at different price levels:
The concentration of buy and sell orders at a particular price level is a key indicator of market liquidity. A high volume of orders on both sides suggests a liquid market. This translates to many willing buyers and sellers at that price, allowing for smoother order execution and potentially tighter spreads. Tighter spreads benefit traders looking to enter or exit trades quickly with minimal price slippage. Conversely, a low volume of orders at a specific price level suggests a less liquid market. This can lead to wider spreads and difficulty in entering or exiting trades at the desired price. Orders might take longer to be filled, and there’s a higher chance of price slippage.
The volume disparity between buy and sell orders at a particular price level can be quite revealing. A significant surplus of buy orders at a support level suggests strong underlying demand for the base currency at that price. This high buying volume can act as a buffer, potentially preventing the price from falling further. Conversely, a surplus of sell orders at a resistance level suggests strong selling pressure, potentially leading to a price decline if the selling volume overwhelms any existing buy orders.
Beyond the overall volume, sudden spikes in order volume at a particular price level can also indicate renewed interest or a shift in sentiment. For example, a sudden surge in buying volume at a support level could signal a potential reversal of a downtrend, attracting more buyers who believe the price may rebound. Conversely, a sharp increase in sell volume at a resistance level could indicate a potential breakout, as more sellers jump in to capitalize on a potential price decline.
While high buy volume at a support level or high sell volume at a resistance level can be encouraging signs, they shouldn’t be considered absolute indicators. These signals should be used in conjunction with other technical analysis tools like price patterns or moving averages for confirmation before entering a trade.
It’s also important to remember that low order volume can sometimes lead to false signals. For instance, a small pocket of strong buying interest at a support level might not be enough to prevent the price from falling further if there’s a lack of overall market participation.
What are some Common Technical Indicators that can be used in Conjunction with Market Depth Analysis?
Market depth analysis, with its insights into order book dynamics, offers a valuable perspective for forex traders. However, to maximize its effectiveness, it should be used in conjunction with other technical analysis tools. Here, we explore some common technical indicators that complement market depth analysis, providing a more comprehensive view of the market:
1. Moving Averages (MAs):
- Identifying Trends: Moving averages smooth out price fluctuations, revealing the underlying trend. By comparing the price to its moving averages (e.g., 50-day or 200-day MA), forex traders can gauge trend direction. Market depth analysis can then be used to refine this understanding. For instance, if the price is above its moving average and there’s a high concentration of buy orders at a potential support level, it strengthens the bullish trend signal. Conversely, if the price is below its moving average and there’s a surplus of sell orders at a resistance level, it reinforces the bearish trend.
2. Relative Strength Index (RSI):
- Gauging Momentum and Potential Reversals: The RSI measures the relative strength or weakness of a price movement. It oscillates between 0 and 100, with readings above 70 indicating overbought conditions (potential for a price pullback) and readings below 30 suggesting oversold conditions (potential for a price rebound). Market depth analysis can add context to RSI readings. For example, an RSI hovering around 70 with a significant increase in sell orders at a resistance level strengthens the possibility of a price reversal.
3. Support and Resistance Levels:
- Confirmation and Refinement: Technical analysis identifies support and resistance levels based on historical price behavior. Market depth analysis can then be used to confirm or refine these levels. A high concentration of buy orders at a potential support level strengthens its validity, while a low volume of orders might suggest a weaker support zone.
4. Price Patterns:
- Identifying Potential Entry and Exit Points: Technical analysis recognizes various price patterns, such as head-and-shoulders or double tops/bottoms, that can signal potential trend reversals. Market depth analysis can be used to identify potential entry and exit points within these patterns. For example, a head-and-shoulders pattern with a surge in sell volume at the neckline (resistance level) strengthens the bearish reversal signal, potentially offering a short-selling opportunity.
How can changes in Order Book activity Signal Potential Trend Reversals or Continuations?
This is where order book activity steps in, acting as a real-time window into the underlying forces shaping market sentiment. By analyzing changes within the order book, traders can gain valuable clues about potential shifts in the prevailing trend.
Shifting Order Imbalance:
A significant imbalance between buy and sell orders at a particular price level can be a strong indicator of a potential trend reversal. If a strong uptrend encounters a support level with a sudden surge in sell orders overwhelming existing buy orders, it suggests a potential shift in sentiment. This could be due to profit-taking by existing long positions or a renewed interest from short sellers. Conversely, a downtrend encountering a resistance level with a sudden influx of buy orders overpowering existing sell orders could signal a potential reversal. This might indicate buying pressure from new market participants or short sellers exiting their positions.
Order Book Thinning:
Another key signal to watch for is a thinning order book near support or resistance levels. This occurs when the concentration of orders on one side (buy or sell) starts to diminish. A thinning support zone, where buy orders are slowly being filled or canceled with minimal replacement, could indicate weakening support and a potential price decline. This might prompt existing long positions to exit before the price falls further. Conversely, a thinning resistance zone, where sell orders are gradually being filled or canceled with minimal replacement orders, could suggest weakening resistance and a potential price increase. This could be an opportunity for existing short positions to exit or for new long positions to enter.
Changes in Order Volume:
Monitoring changes in order volume at different price levels can also provide clues about potential trend continuations. In a strong uptrend, a consistent increase in buy volume at support levels can reinforce the bullish sentiment and a potential continuation of the uptrend. Conversely, in a strong downtrend, a consistent increase in sell volume at resistance levels can solidify the bearish sentiment and a potential continuation of the downtrend.
Volume Spike Confirmation:
It’s important to note that not all changes in order book activity automatically signal a trend reversal. Sudden spikes in order volume can sometimes be short-lived and may not translate into a lasting trend shift. For confirmation, traders should look for these changes in order book activity to be accompanied by corresponding price movements and potentially supported by other technical indicators.
Are there any Advanced Market Depth Analysis Techniques used by Professional Forex Traders?
Here, we explore some advanced market depth analysis techniques used by these professionals:
1. Order Book Level-2 Analysis:
Standard market depth displays provide a general overview of buy and sell order volumes at different price levels. Professional traders often utilize Level-2 or Level-3 order book data, which offer a more granular view. This data reveals the specific sizes of individual orders at each price level. By analyzing the distribution of order sizes, professionals can gain insights into the intentions of different market participants. For example, a large cluster of small buy orders might indicate retail investor interest, while a single large buy order could suggest institutional buying or intervention.
2. Time-Weighted Average Order Book (TWAP) Analysis:
The TWAP analysis goes beyond the current order book snapshot and considers the historical order book data over a specific timeframe. By calculating the average price at which buy and sell orders were placed within that timeframe, professionals can gauge the overall buying and selling pressure at different price levels. This can be particularly useful for identifying hidden support and resistance zones that might not be readily apparent from a static order book view.
3. Footprint Charts:
Footprint charts are a visual representation of order book activity, depicting each buy and sell order as a footprint at its corresponding price and volume level. Professionals use these charts to analyze the aggressiveness of buying and selling at different price levels. For example, large, aggressive buy orders with minimal sell orders above them could indicate strong buying pressure and a potential breakout. Conversely, large sell orders with minimal buy orders below could signal strong selling pressure and a potential breakdown.
4. Algorithmic Order Book Analysis:
In the fast-paced world of professional forex trading, speed is crucial. Some professionals leverage sophisticated algorithms to analyze order book data in real-time. These algorithms can identify complex patterns and imbalances within the order book, potentially quicker than human analysis. This allows professionals to react swiftly to fleeting opportunities and capitalize on short-term market movements.
5. Combining Order Flow with Other Advanced Techniques:
Advanced market depth analysis doesn’t exist in isolation. Professional traders often combine it with other sophisticated technical analysis tools like volume profile analysis or market delta analysis. Volume profile analysis identifies areas of high trading activity within a specific price range, while market delta tracks the cumulative difference between buy and sell volume over time. By integrating these techniques with order book analysis, professionals can gain a holistic understanding of market dynamics and make more informed trading decisions.
How can Forex Traders Identify and avoid Potential Order Book manipulation Tactics?
The foreign exchange market, while vast and dynamic, is not immune to manipulation. Unscrupulous actors may attempt to influence order book activity to their advantage. As a forex trader, being aware of potential manipulation tactics and understanding how to identify them is crucial for protecting your capital and making informed decisions.
Here are some ways forex traders can identify and avoid potential order book manipulation tactics:
Unnatural Order Book Imbalance:
One red flag to watch for is an unnatural imbalance between buy and sell orders at a particular price level. This could involve a sudden surge in buy orders at a support level with minimal corresponding price movement, or a surge in sell orders at a resistance level that doesn’t lead to a significant price drop. These imbalances might be created by large players attempting to push the price in a desired direction before quickly withdrawing their orders.
Suspicious Order Book Activity:
Be wary of sudden spikes in order volume that disappear just as quickly. These could be spoofing tactics, where large orders are placed and then canceled rapidly to create a false impression of strong buying or selling pressure. This can mislead other traders into entering positions that benefit the manipulator.
Price Inconsistencies with Order Book:
If the price movement doesn’t seem to reflect the order book activity, it could be a sign of manipulation. For example, a price might continue to rise despite a significant increase in sell orders, or it might fall even with a surge in buy orders. This could be due to hidden orders or off-exchange trading activity that isn’t reflected in the displayed order book.
Limited Liquidity:
Order book manipulation often thrives in markets with low liquidity. In such markets, a smaller amount of capital can be used to create a more significant impact on price movements. Be cautious of trading in currency pairs with low liquidity, as they are more susceptible to manipulation tactics.
Confirmation from Other Indicators:
While order book analysis offers valuable insights, it shouldn’t be used in isolation. Always consider the broader market context. If you suspect manipulation based on order book activity, look for confirmation from other technical indicators or fundamental news events. If the price movement doesn’t align with the overall market sentiment, it’s best to exercise caution and avoid entering trades.
Focus on Reputable Brokers:
Choosing a reputable and well-regulated forex broker is essential. Regulated brokers are subject to stricter oversight and are less likely to tolerate manipulative practices on their platforms. By partnering with a trusted broker, you gain an additional layer of protection against potential manipulation.
What are the Limitations of Relying Solely on Market Depth Analysis for making Trading Decisions?
Market depth analysis, with its ability to unveil order book dynamics, offers a valuable perspective for forex traders. However, it’s crucial to recognize the limitations of relying solely on this tool for making trading decisions. Here’s why a more comprehensive approach is essential:
Limited Scope: Market depth analysis primarily focuses on the current state of buy and sell orders within the order book. This provides a snapshot of supply and demand at specific price levels, but it doesn’t account for the broader market context. Fundamental factors like economic data releases, geopolitical events, and central bank policies can significantly influence price movements. Ignoring these external influences can lead to missed opportunities or costly mistakes.
Short-Term Focus: The order book is a dynamic entity, constantly changing as new orders are placed, existing orders are filled or canceled, and prices fluctuate. While this real-time data is valuable for identifying short-term trading opportunities, it doesn’t necessarily predict long-term trends. Relying solely on market depth analysis can lead traders to become overly fixated on short-term price movements, potentially missing out on opportunities that align with their long-term trading goals.
Potential for Manipulation: The order book is not immune to manipulation. Unscrupulous actors may use spoofing tactics, where large orders are placed and then canceled rapidly, to create a false impression of strong buying or selling pressure. This can mislead traders relying solely on order book data into entering positions that benefit the manipulator. A well-rounded trading strategy should incorporate safeguards against such tactics.
How does Market Depth Analysis compare to other technical analysis tools used in forex trading?
The foreign exchange market, with its vast liquidity and constant movement, presents both opportunities and challenges for traders. While technical analysis offers valuable tools for gauging market sentiment and potential price movements, a deeper understanding of market dynamics is essential for success. This is where market depth analysis steps in, acting as a powerful window into the underlying forces shaping the forex market. By analyzing the volume and distribution of buy and sell orders at different price levels, forex traders can gain valuable insights into supply and demand, identify potential entry and exit points, and ultimately navigate the complexities of the market with greater confidence. This comprehensive guide explores the intricacies of market depth analysis, delving into how it informs trading strategies, how to identify potential manipulation tactics, and how advanced techniques can further empower professional traders. As you embark on this journey, remember, mastering market depth analysis is not simply acquiring knowledge; it’s about unlocking a hidden language that speaks volumes about the forex market’s inner workings.
What Resources are available to help Forex Traders improve their Market Depth Analysis Skills?
Forex traders seeking to hone their market depth analysis skills have a wealth of resources at their disposal. Online forex brokers often provide educational materials specifically focused on order book analysis, including video tutorials, articles, and webinars. Additionally, many financial websites and forex blogs offer in-depth guides and strategies for interpreting order book dynamics. Furthermore, some online platforms offer simulated trading environments where traders can practice their skills and experiment with different market depth analysis techniques in a risk-free setting. By actively engaging with these resources and practicing their analysis, forex traders can develop a deeper understanding of market depth and leverage it to make more informed trading decisions.