
Forex traders navigate a dynamic market where anticipating price movements is essential for success. Technical analysis, the study of historical price and volume data, equips traders with valuable tools for informed decision-making. One cornerstone of technical analysis is the use of chart patterns. These recurring visual formations on price charts can act as signposts, hinting at potential future price movements and allowing traders to identify entry and exit points for their trades.
Dozens of recognized chart patterns exist, each with its own characteristics and implications. Reversal patterns, like head and shoulders or double tops/bottoms, suggest a potential shift in the current trend. For instance, a head-and- shoulders pattern is characterized by a central peak (head) followed by two lower peaks (shoulders), often accompanied by a neckline (support level). A break below the neckline on a downtrending chart might signal a trend reversal towards an uptrend. Conversely, continuation patterns, like ascending triangles or flags, indicate that the prevailing trend is likely to resume after a period of consolidation. An ascending triangle, formed by converging trendlines (one horizontal, one sloping upwards), suggests a potential breakout to the upside in a prevailing uptrend. By understanding these key chart patterns and their interpretations, forex traders can gain valuable insights into market sentiment and make more informed trading decisions, potentially increasing their chances of success in the fast-paced world of forex trading.
What are Chart Patterns, and how do they help Forex Traders?
Chart patterns, recognizable formations on price charts, emerge from repetitive cycles of buying and selling behavior. These patterns act like visual road signs, hinting at where prices might be headed next. There are three main types: reversal patterns that suggest a trend shift, continuation patterns indicating a pause before the trend resumes, and bilateral patterns that can be trickier to interpret as they might signal either a continuation or reversal. By recognizing these patterns, forex traders gain valuable insights. They can identify potential turning points to adjust positions or exit trades before a trend reversal, spot breakout opportunities to capitalize on ongoing trends, and ultimately make more informed trading decisions based on historical patterns and potential future movements. It’s important to remember that chart patterns are not guarantees, but they are a powerful tool for navigating the complexities of the forex market.
Grasping the directional Implications of Different Chart Patterns.
Chart patterns, recurring visual formations on price charts, offer valuable clues about where prices might be headed next. By understanding these patterns and their directional implications, forex traders can gain a significant advantage.
There are three main categories of chart patterns, each conveying a distinct message about the prevailing trend:
- Reversal Patterns: These patterns, like head and shoulders or double tops/bottoms, suggest a potential shift in the current trend. Imagine a head-and-shoulders formation on a downtrend chart. If the price breaks below a key support level (neckline), it might signal a trend reversal towards an uptrend. Conversely, reversal patterns like inverse head and shoulders in an uptrend could hint at a potential shift towards a downtrend.
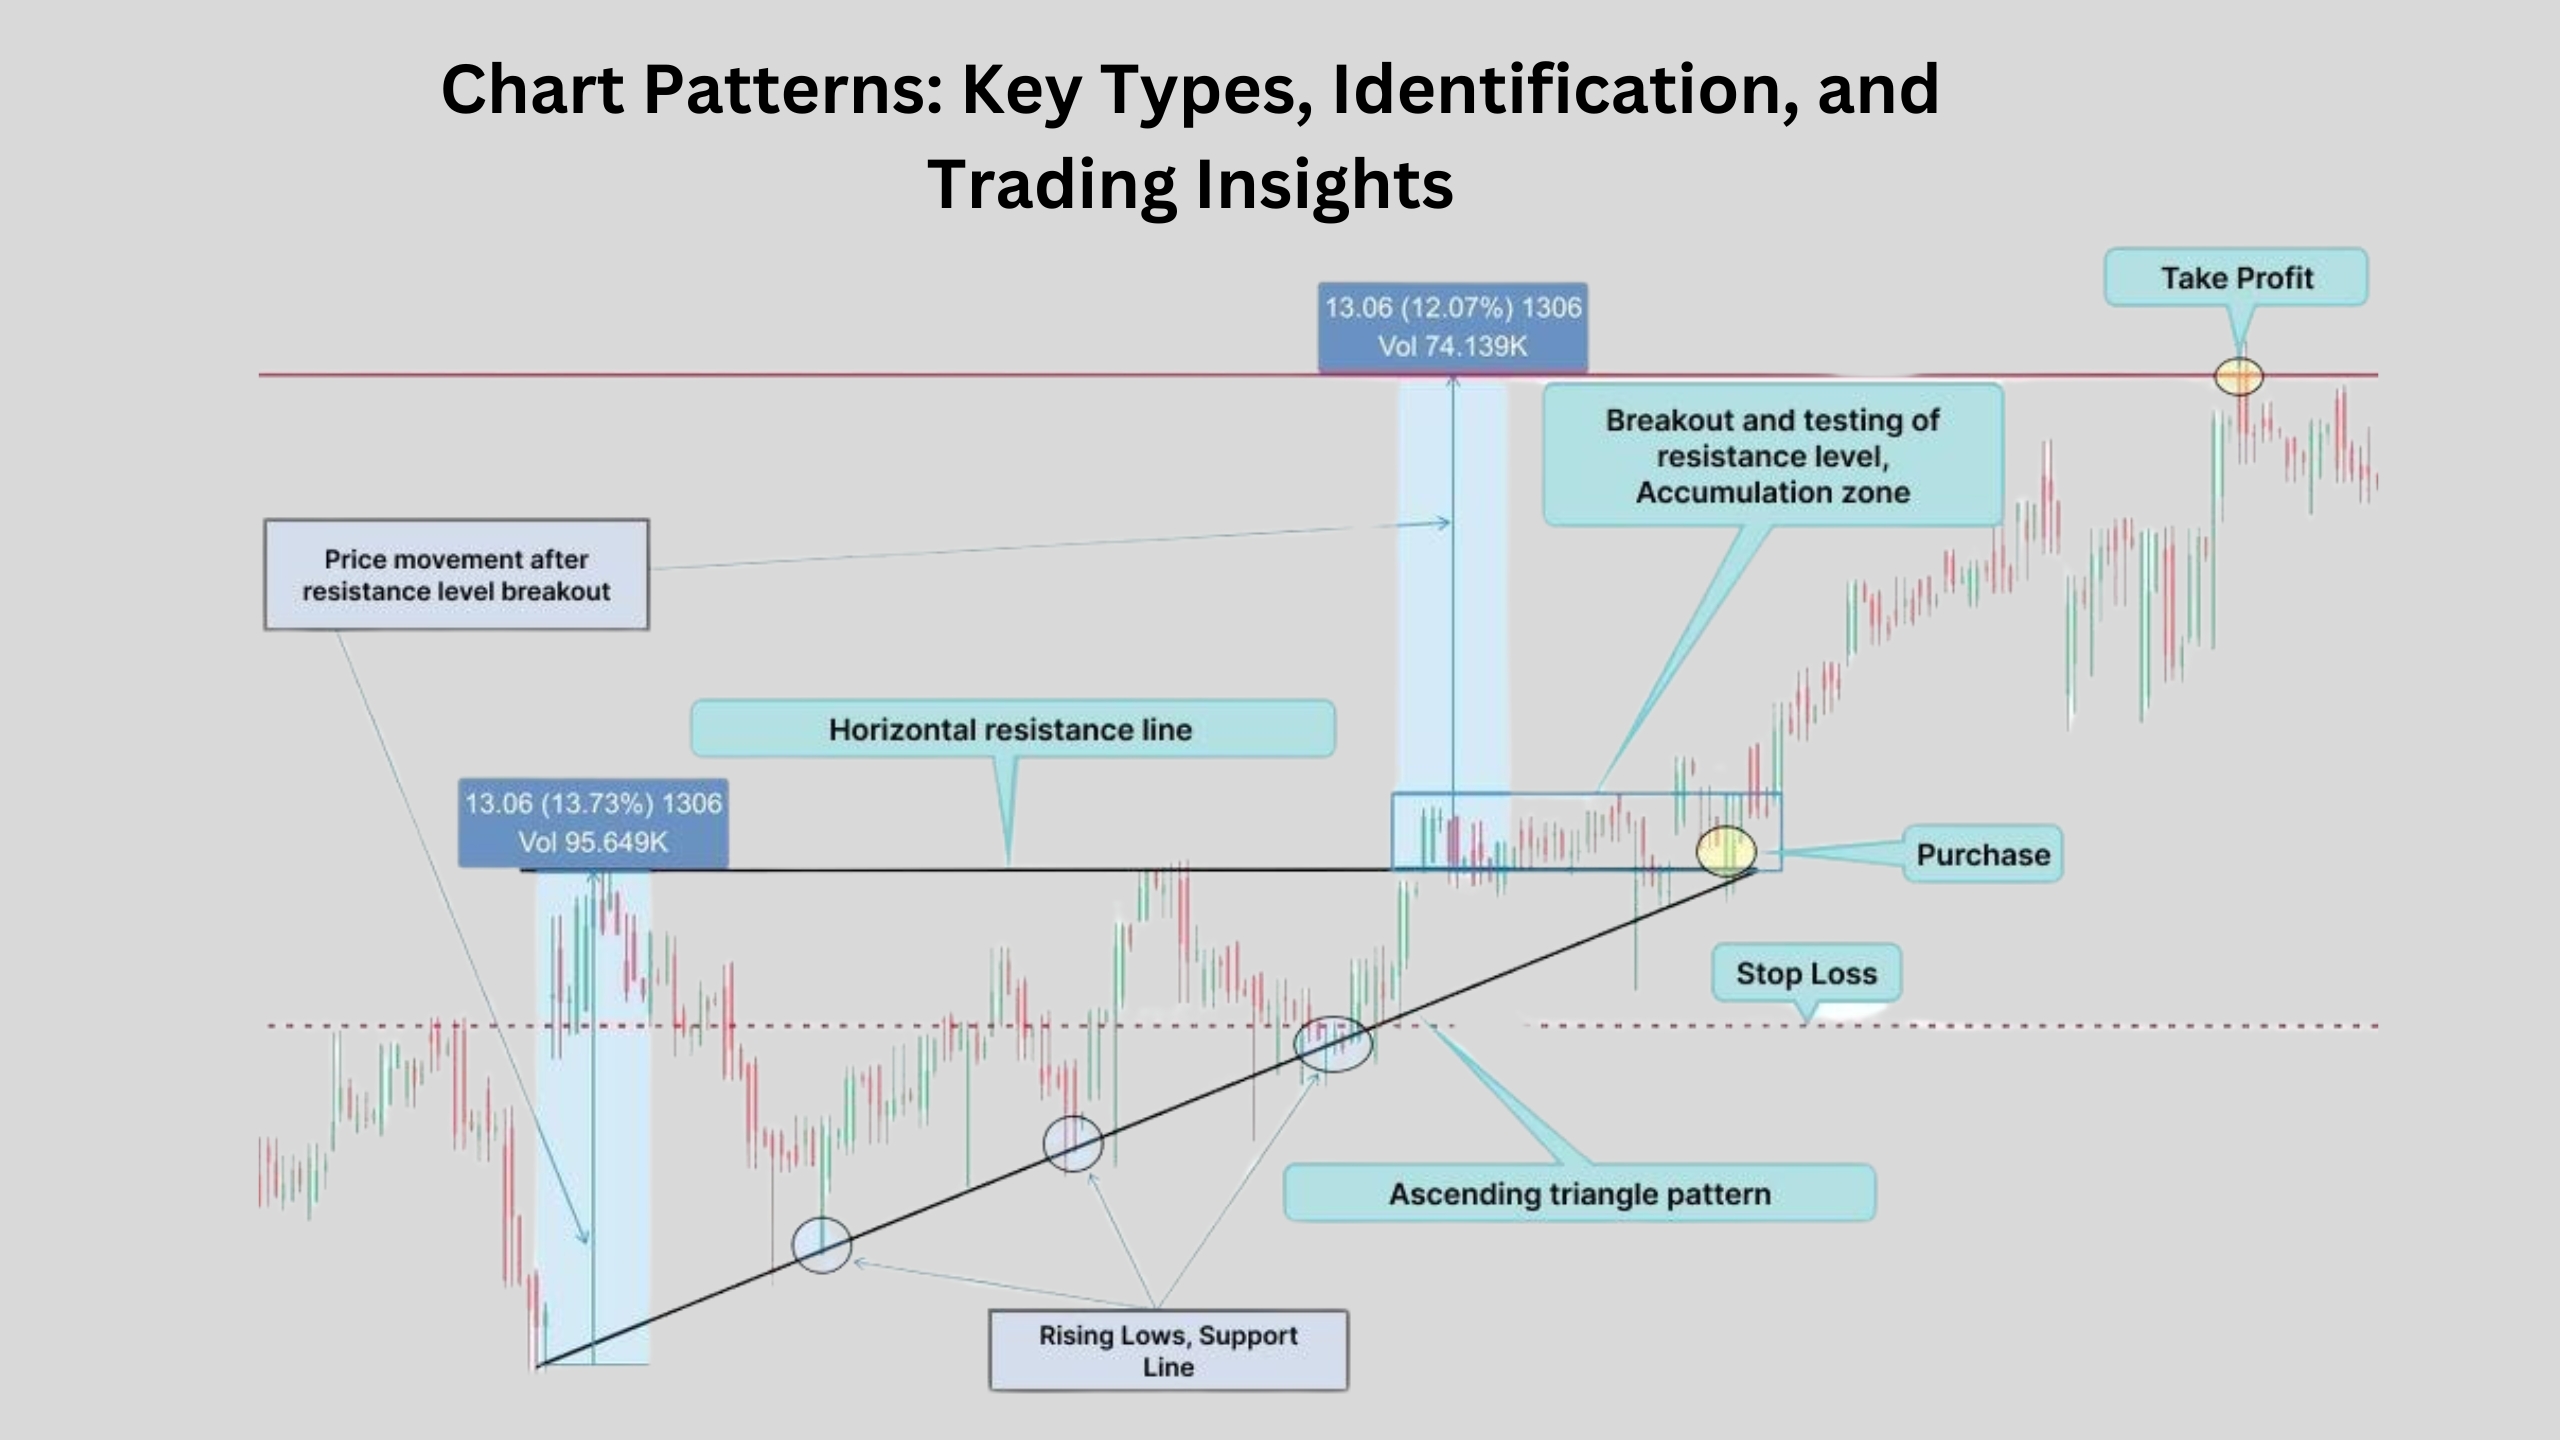
- Continuation Patterns: These patterns, like ascending triangles or flags, indicate a pause or consolidation before the prevailing trend resumes. An ascending triangle in an uptrend suggests the uptrend is likely to continue after a period of price stabilization. A breakout above the triangle’s upper trendline could signal this continuation. Similarly, flags and pennants within an uptrend suggest a temporary pause before the uptrend picks up again.
- Bilateral Patterns: These patterns, like wedges, are trickier to interpret as they can signal either a continuation or a reversal. For instance, an ascending wedge might lead to a breakout upwards, continuing the uptrend, or a breakout downwards, signifying a trend reversal. Identifying reliable breakout confirmations from bilateral patterns is crucial for making informed trading decisions based on these signals.
By grasping the directional implications of these different chart patterns, forex traders can:
- Position themselves strategically: Anticipating potential trend reversals allows traders to adjust their positions or exit trades before the reversal occurs, potentially minimizing losses.
- Capitalize on Breakout Opportunities: Recognizing continuation patterns can help traders identify entry points to benefit from the continuation of a strong trend.
- Make Informed Decisions: While not foolproof, understanding chart patterns equips traders to analyze price behavior within a historical context and make more informed choices based on potential future movements.
Head and Shoulders, Double Tops/Bottoms, Inverse Head and Shoulders (exploring their formation, identification techniques, and potential false signals).
These three chart patterns – Head and Shoulders, Double Tops/Bottoms, and Inverse Head and Shoulders – are fundamental reversal patterns used extensively in forex trading. They all signal a potential shift in the current trend, offering valuable insights to traders. Let’s delve into their formation, identification techniques, and the potential for false signals.

Formation:
- Head and Shoulders (Downtrend): This pattern resembles a human silhouette. It consists of a central peak (head) followed by two lower peaks (shoulders) on either side. A horizontal line, called the neckline, connects the swing lows (troughs) before the head and the left shoulder. A break below this neckline signifies a potential trend reversal from downtrend to uptrend.
- Double Tops/Bottoms: These patterns are characterized by two consecutive highs (double top) or lows (double bottom) with a trough (top) or peak (bottom) separating them. In a downtrend, a double top suggests a temporary halt in the downward momentum, followed by a potential reversal if the price breaks below the trough. Conversely, in an uptrend, a double bottom might indicate a temporary pause before a potential trend reversal upwards if the price breaks above the peak.
- Inverse Head and Shoulders (Uptrend): This pattern is essentially the inverse of the head and shoulders, mirroring its formation but flipped upside down. It features a low central peak (head) flanked by two higher peaks (shoulders) on either side. A neckline connects the swing highs before the head and the left shoulder. A break above this neckline signifies a potential trend reversal from uptrend to downtrend.
Identification Techniques:
- Visual Confirmation: Carefully examine the price chart for the distinct formations described above. Each peak and trough should be clearly visible, and the neckline should be a reasonably horizontal line connecting the swing lows in reversal patterns for downtrends or swing highs in uptrends.
- Volume Analysis: Ideally, there should be a decrease in trading volume as the head forms, suggesting waning conviction in the prevailing trend. Conversely, a surge in volume can accompany the breakout above/below the neckline, signifying a potential shift in momentum.
False Signals:
It’s important to remember that no chart pattern is foolproof. Here’s how to be cautious of false signals:
- Failed Breakouts: Sometimes, the price might touch the neckline but fail to break decisively below (downtrend patterns) or above (uptrend patterns). This can lead to false reversal signals.
- Shallow Necks: A very shallow neckline might make it difficult to determine a clear breakout point, increasing the chances of misinterpreting the pattern.
Mitigating False Signals:
- Confirmation from Technical Indicators: Combining chart patterns with technical indicators like moving averages or RSI can help strengthen the reversal signal. For instance, a price breaking below the neckline while a moving average also slopes downwards reinforces the downtrend reversal.
- Price Action: Observe price action around the neckline. Doji candlesticks or other reversal candlestick patterns near the neckline can add weight to the reversal signal from the head and shoulders pattern.
Head and Shoulders (after breakout), Wedges (ascending/descending), navigating the challenges of interpreting bilateral signals.
While head and shoulders, double tops/bottoms, and inverse head and shoulders are widely recognized reversal patterns, forex traders should also be aware of bilateral chart patterns. Unlike clear-cut reversal signals, bilateral patterns can indicate either a continuation or a reversal, making them trickier to interpret. Here, we explore two common bilateral patterns: Head and Shoulders (after breakout) and Wedges (ascending/descending).
Head and Shoulders (after breakout):
This isn’t a traditional head and shoulders pattern, but rather a continuation signal based on a confirmed breakout. Here’s how it works:
- Imagine a standard head and shoulders pattern in a downtrend.
- If the price decisively breaks above the neckline, it negates the initial downtrend reversal signal.
- This breakout suggests a potential trend continuation towards an uptrend.
Identification:
- Look for a completed head and shoulders pattern in an established downtrend.
- The key element is a clear break above the neckline with a surge in volume, signifying a shift in momentum.
Wedges (Ascending/Descending):
Wedges are formed by converging trendlines, narrowing the price movement over time. They can be categorized as ascending wedges (trendlines slope upwards) or descending wedges (trendlines slope downwards).
- Ascending Wedge: This pattern can be bullish or bearish. A breakout above the upper trendline might signal a continuation of the uptrend, while a breakout below the lower trendline could indicate a trend reversal towards a downtrend.
- Descending Wedge: Similar to ascending wedges, these can be bullish or bearish. A breakout below the lower trendline might suggest a continuation of the downtrend, while a breakout above the upper trendline could hint at a trend reversal towards an uptrend.
Challenges of Bilateral Signals:
The key difficulty with bilateral patterns lies in their ambiguity. The breakout direction determines whether the pattern signals continuation or reversal. Here’s how to navigate these challenges:
- Confirmation is Crucial: Look for additional confirmation signals like increased volume on the breakout or support from technical indicators to strengthen the breakout direction’s validity.
- Volatility Matters: High volatility can exacerbate the difficulty of interpreting wedge breakouts. Consider waiting for the price to stabilize after the breakout for a clearer confirmation.
- False Breakouts: Be wary of false breakouts, where the price pierces a trendline but quickly reverses back within the wedge.
How do Chart Patterns help Forex Traders anticipate Potential Trend Reversals or Continuations?
Chart patterns serve as visual road signs on price charts, helping forex traders anticipate potential trend reversals or continuations. Reversal patterns, like head and shoulders or double tops/bottoms, are like caution signs. A head-and-shoulders pattern on a downtrend, for example, might indicate a trend reversal towards an uptrend if the price breaks below a key support level (neckline). Conversely, continuation patterns like ascending triangles or flags function like yield signs. An ascending triangle in an uptrend suggests a pause before the uptrend resumes. A breakout above the triangle’s upper trendline could signal this continuation. By recognizing these patterns, forex traders can:
- Identify Potential Turning Points: Reversal patterns can warn of a potential trend shift, allowing traders to adjust their positions or exit trades before the trend reverses.
- Spot Breakout Opportunities: Continuation patterns can signal when a trend might resume after consolidation, helping traders identify potential entry points to capitalize on the ongoing trend.
It’s important to remember that chart patterns are not guarantees. Confirmation from other technical indicators is crucial before making trading decisions. However, understanding these patterns equips forex traders to anticipate potential trend behavior and make more informed choices in the fast-paced world of forex trading.
Unveiling lesser-known reversal patterns (e.g., Rising/Falling Wedges, Rounding Tops/Bottoms) and their significance.
While head and shoulders and double tops/bottoms are forex trading staples, the world of chart patterns offers a treasure trove of lesser-known formations with valuable insights. Here, we delve into two such reversal patterns: Rising/Falling Wedges and Rounding Tops/Bottoms, exploring their significance for forex traders.
1. Rising/Falling Wedges (Variations of Bilateral Wedges):
These patterns are variations of the ascending/descending wedges discussed previously, but with a more specific directional bias.
- Rising Wedge: This pattern resembles a rising channel, formed by trendlines that converge upwards. Unlike regular wedges, rising wedges tend to favor a bullish breakout. A breakout above the upper trendline, often accompanied by increased volume, suggests a potential trend reversal towards an uptrend.
- Falling Wedge: Similar to rising wedges, falling wedges are formed by trendlines converging downwards but with a bearish bias. A breakout below the lower trendline, supported by higher volume, might indicate a trend reversal towards a downtrend.
Significance:
Both rising and falling wedges can be powerful reversal signals, especially when combined with other technical indicators. The converging trendlines suggest a period of price consolidation, potentially leading to a breakout in the opposite direction of the prevailing trend.
2. Rounding Tops/Bottoms:
These patterns offer a smoother visual representation of potential trend reversals compared to the sharp peaks and troughs of head and shoulders.
- Rounding Top: This pattern resembles a rounded hill on the price chart, often seen at the end of an uptrend. The price gradually curves downwards, forming a smooth peak before reversing. A breakout below the support level (established by the bottom of the rounded shape) suggests a potential trend reversal towards a downtrend.
- Rounding Bottom: Opposite to rounding tops, rounding bottoms form at the end of downtrends. The price gradually curves upwards, forming a smooth trough before reversing. A breakout above the resistance level (established by the top of the rounded shape) suggests a potential trend reversal towards an uptrend.
Significance:
Rounding tops/bottoms can provide valuable early warnings of potential trend reversals. The gradual price movement allows for a more nuanced interpretation compared to sharper reversal patterns.
When are Chart Patterns most reliable?
Chart patterns aren’t crystal balls, and their reliability can vary depending on several factors. Generally, well-defined patterns with clear breakouts and strong supporting elements like volume tend to be more reliable. Here’s what to consider:
- Clarity of the Pattern: A clearly defined chart pattern with distinct peaks, troughs, and trendlines is easier to interpret and potentially more reliable than a messy or ambiguous formation.
- Confirmation from Breakouts: A decisive breakout above/below a key support/resistance level, often accompanied by a surge in volume, strengthens the pattern’s validity.
- Market Context: The prevailing market trend can influence the reliability of chart patterns. For instance, reversal patterns might be more reliable in a mature trend nearing exhaustion, while continuation patterns might be more trustworthy in a strong trending market.
- Confirmation from Technical Indicators: Combining chart patterns with technical indicators like moving averages or RSI can provide additional confirmation and strengthen the signal’s reliability.
Combining Chart Patterns with other technical analysis techniques for a well-rounded trading strategy.
While chart patterns offer valuable insights into potential price movements, they shouldn’t be the sole pillar of your forex trading strategy. For a more well-rounded approach, consider integrating chart patterns with other technical analysis techniques:
- Technical Indicators: Tools like moving averages, Relative Strength Index (RSI), and Bollinger Bands can provide additional confirmation for chart pattern signals. For example, a head and shoulders pattern with a price breaking below the neckline while the moving average also slopes downwards strengthens the downtrend reversal signal.
- Price Action: Examining candlestick patterns and price behavior around support and resistance zones can further refine your analysis. Doji candlesticks near the neckline of a head and shoulders pattern can add weight to the reversal signal.
- Volume Analysis: Monitoring trading volume can be crucial. Ideally, there should be a decrease in volume as a reversal pattern forms, suggesting waning conviction in the prevailing trend. Conversely, a surge in volume can accompany a breakout, signifying a potential shift in momentum.
- Trend Analysis: Understanding the overall market trend is essential. Reversal patterns are more likely to be successful in a mature trend nearing exhaustion. Conversely, continuation patterns might be more trustworthy in a strong trending market.
By combining chart patterns with these additional techniques, you create a more comprehensive picture of the market dynamics. This multifaceted approach can help you:
- Strengthen Signal Confirmation: Each technique adds another layer of confirmation, increasing your confidence in the validity of a trade signal.
- Identify False Signals: Combining indicators can help you avoid misinterpreting chart patterns. For example, a head and shoulders pattern might appear, but if the RSI doesn’t show overbought conditions, it might be a false reversal signal.
- Develop a More Informed Trading Strategy: By utilizing a combination of technical analysis tools, you can make more informed decisions about entry and exit points, potentially improving your overall trading performance.
Recognizing limitations of chart patterns and avoiding over-reliance on them.
While chart patterns offer valuable insights into potential price movements in forex trading, they shouldn’t be the sole pillar of your strategy. For a more well-rounded approach, consider integrating them with other technical analysis techniques:
- Technical Indicators: Tools like moving averages, Relative Strength Index (RSI), and Bollinger Bands can provide additional confirmation for chart pattern signals. Imagine a head and shoulders pattern with a price breaking below the neckline. If the moving average also slopes downwards, it strengthens the downtrend reversal signal from the chart pattern.
- Price Action: Examining candlestick patterns and price behavior around support and resistance zones can further refine your analysis. For example, Doji candlesticks near the neckline of a head and shoulders pattern can add weight to the reversal signal.
- Volume Analysis: Monitoring trading volume is crucial. Ideally, there should be a decrease in volume as a reversal pattern forms, suggesting waning conviction in the prevailing trend. Conversely, a surge in volume can accompany a breakout, signifying a potential shift in momentum.
- Trend Analysis: Understanding the overall market trend is essential. Reversal patterns are more likely to be successful in a mature trend nearing exhaustion. Conversely, continuation patterns might be more trustworthy in a strong trending market.
Books and online courses for in-depth learning about chart patterns and technical analysis.
Expand your knowledge of chart patterns and technical analysis to become a more well-rounded forex trader. Dive into resources like books by Jack Schwager (“Getting Started in Technical Analysis”) for a foundational understanding and John Murphy’s comprehensive guide, “Technical Analysis of the Financial Markets.” For an interactive learning experience, explore online courses from reputable platforms that delve into chart patterns and technical analysis led by experienced instructors. Remember, consistent learning and practice are key to success in the forex market, so leverage these resources to hone your technical analysis skills and gain a deeper understanding of the tools at your disposal.