
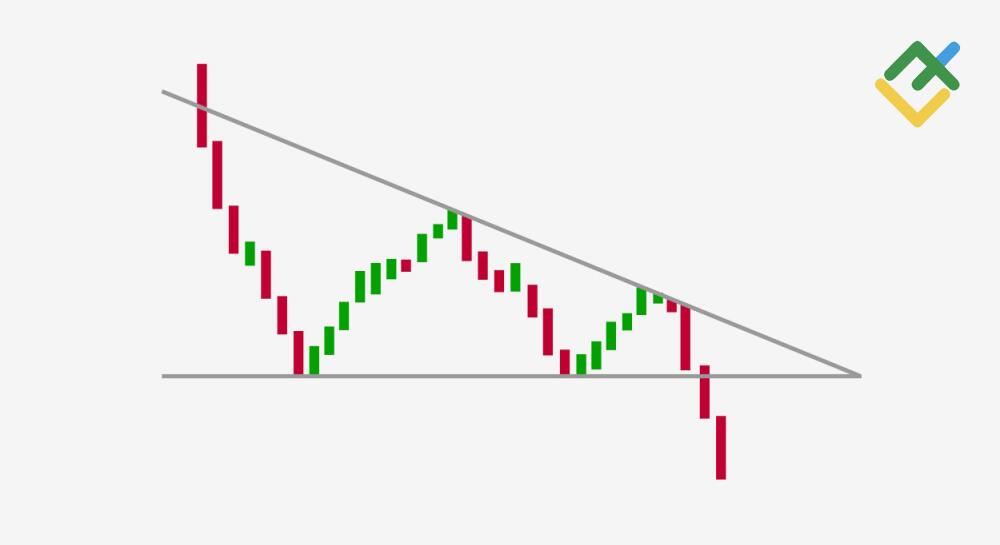
Descending Triangle: What Is It? Importance, How to Trade, and Benefits
A descending triangle pattern is one of the most prominent continuation patterns that arise in the mid-trend. A descending triangle pattern is also known as a falling triangle pattern. A flat lower trendline serves as support and a falling upper trendline makes up the descending triangle, a bearish pattern. This pattern suggests that sellers are […]
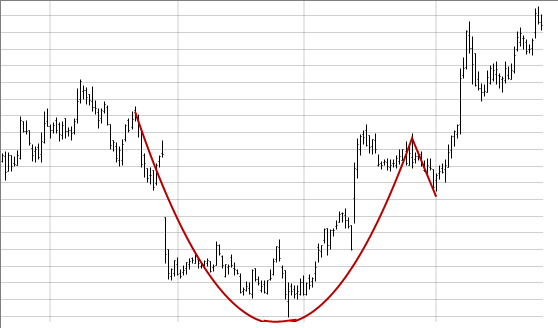
Cup and Handle Pattern: Technical Analysis, How To Identify, Advantages and Disadvantages
The Cup and Handle is a technical chart pattern, which acts as a bullish signal and it features a structure that is similar to a “u” form having a small downward drift. The Cup and Handle forms during a small time frame or take weeks. The Cup and Handle Pattern are identified with the help […]
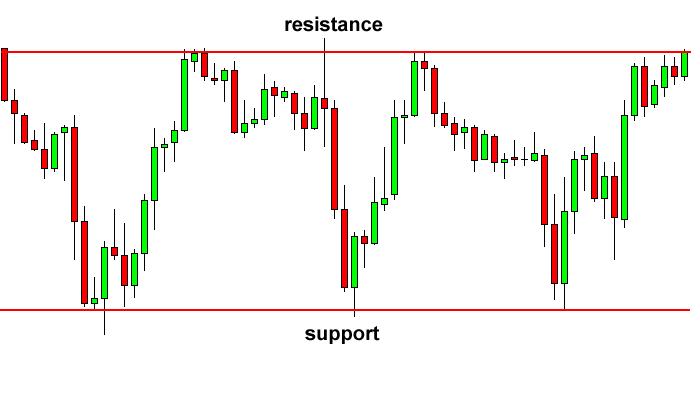
Rectangle Chart Pattern: Definition, How It Works, What It Indicates, and How to Trade It?
The rectangle chart pattern forms when the price of a security trades between two parallel and horizontal support and resistance levels for an extended period. The rectangular pattern consolidation creates a rectangular shape on the price chart as the price bounces between support and resistance. The rectangle indicates a balance between buyers and sellers agreeing […]
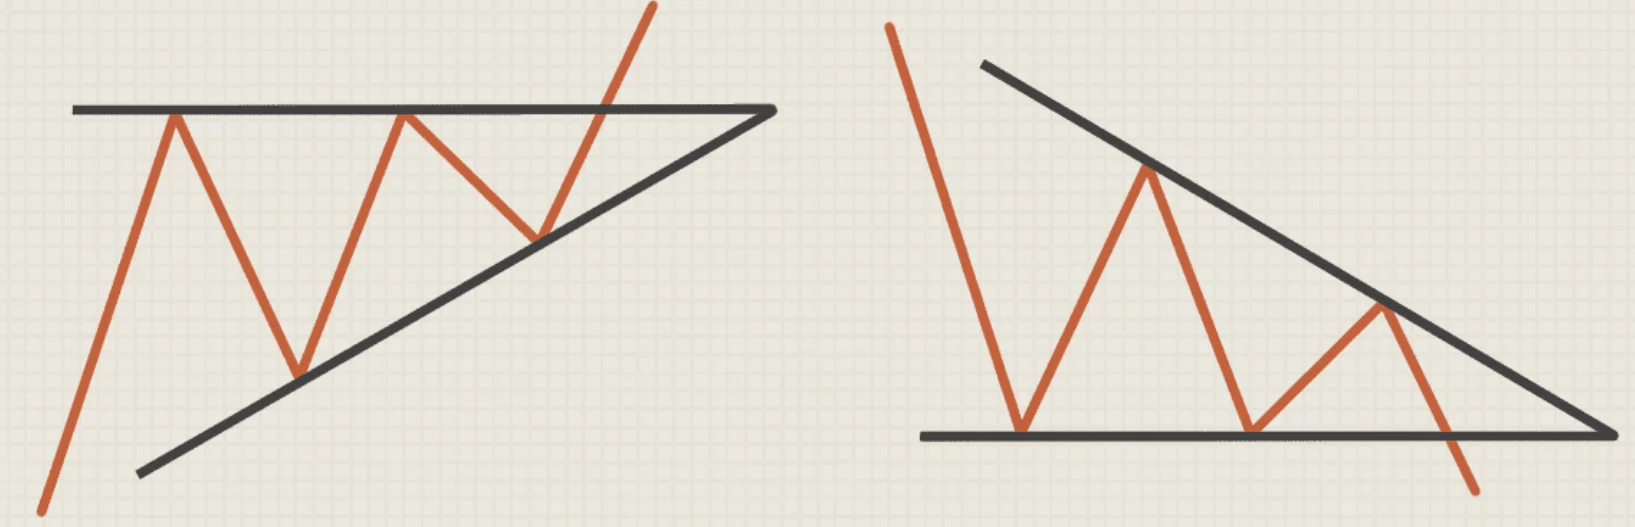
Wedge Pattern: Definition, Key Features, Types, How to Trade, and Advantages
A wedge pattern is a price pattern identified by converging trend lines on a price chart. The wedge pattern is frequently seen in traded assets like stocks, bonds, futures, etc. The characteristic feature of the pattern is the narrowing price range between two trend lines that are converging towards each other, creating a wedge shape. […]
Rising Wedge Pattern: Definition, Formation, Characteristics, and How to Trade
A rising wedge pattern is a price chart candlestick formation that signals a bearish trend reversal. A rising wedge pattern is formed by two converging trend lines. Rising wedge patterns indicate the potential of an upcoming bearish reversal, as the breakout usually takes place through the lower trend line. Rising wedge patterns are commonly formed […]
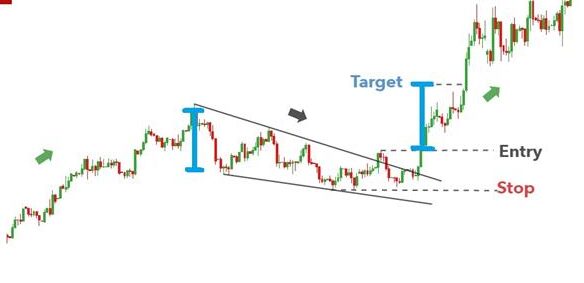
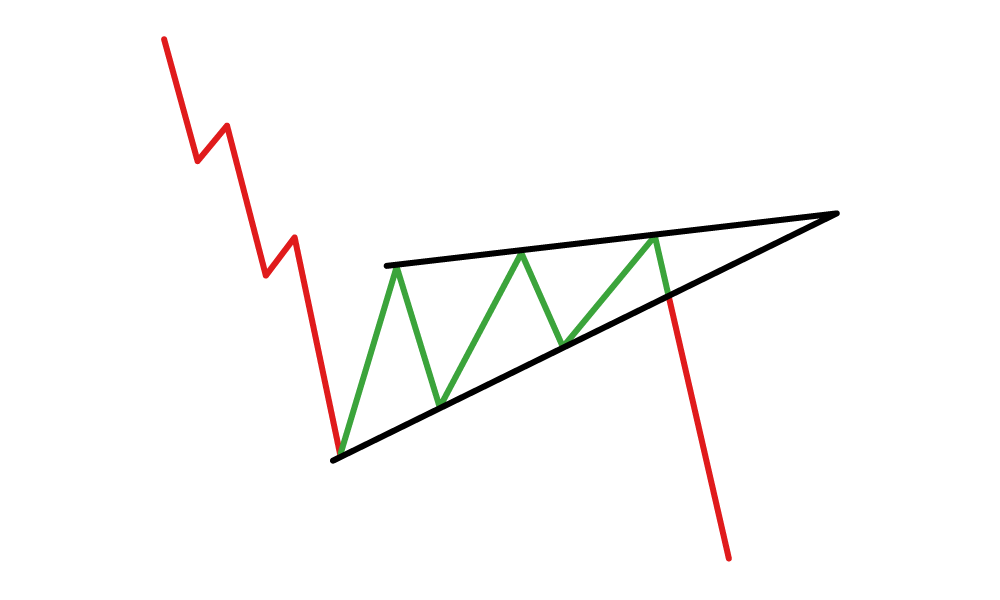
Falling Wedge Pattern: What is it? How it Works? and How to Trade?
The falling wedge pattern is a continuation pattern that forms when the price oscillates between two trendlines sloping downward and converging. A falling wedge pattern is regarded as a bullish chart formation, it can also signify continuation or reversal patterns depending on where it appears in the trend. There is significant confusion in identifying the […]